

SUBSCRIBE TO OUR FREE NEWSLETTER
Daily news & progressive opinion—funded by the people, not the corporations—delivered straight to your inbox.
5
#000000
#FFFFFF
To donate by check, phone, or other method, see our More Ways to Give page.
The fate of the Build Back Better Act is currently unknown. The bill would be the largest social spending achievement in decades and provide needed services and support to millions of families--with more than half of the proposed $1.75 trillion in spending going to child care, preschool, affordable housing, higher education and healthcare.
But this proposed spending, over 10 years, is barely noticeable compared with the wages workers have lost over the past 40 years. In terms of productivity, wages should be significantly higher than they are, and the average worker continues to be shortchanged thousands of dollars annually. And much of the money workers should be getting is instead being pumped up to the top 0.3% of income earners.
How Much Money Have Workers Lost?
The following chart from the Economic Policy Institute (EPI), an independent think tank, shows the growing gap between productivity and worker pay since 1979, during which productivity grew 3.5 times as much as pay.
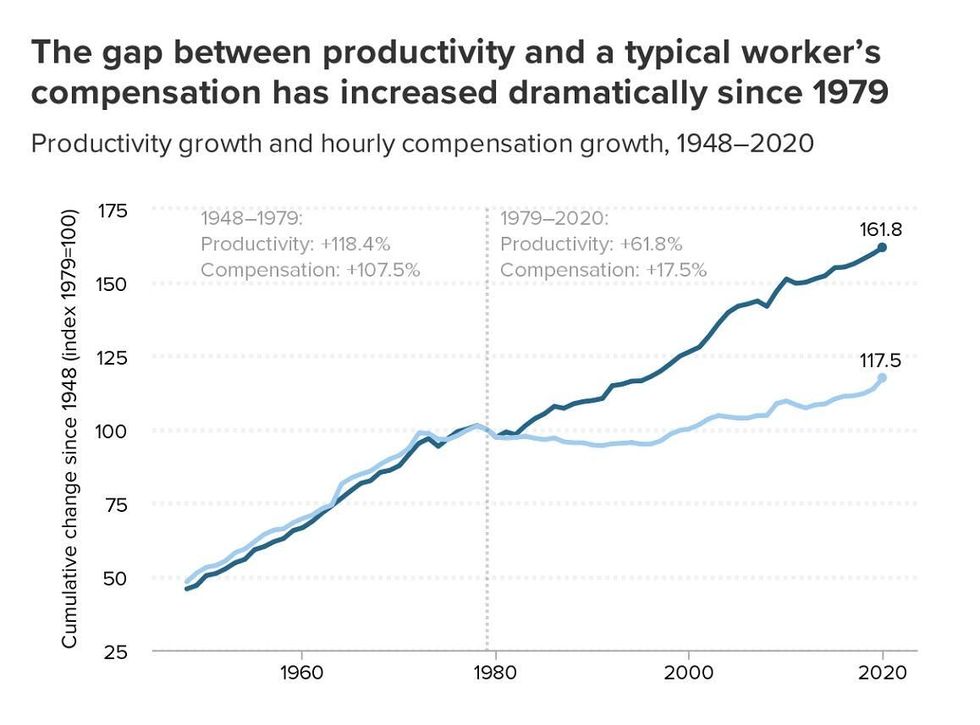
A number of factors have contributed to this productivity-wage gap. According to EPI, starting in the late 1970s, more unemployment has been tolerated to reduce inflation, the federal minimum wage has been raised less often, the deregulation of a number of industries has kept wages lower, corporate globalization has increased, wage theft has grown, and labor laws have failed to stop growing employer hostility toward unions. As unions declined, they had less power in their industries and therefore less ability to negotiate better wages to capture productivity gains.
In the chart, the line tracking productivity soars while the line tracking wages stagnates. As the two diverge, income inequality increases.
Less explored than the causes of the productive-wage gap is how much this gap is actually costing workers in real dollars--and where that lost income is going instead. As EPI's Lawrence Mishel and Josh Bivens calculate, if wages had kept pace with productivity, then the median hourly wage (adjusted for inflation) in 2017 would have been $33.10. The actual median hourly wage in 2017 was $23.15, a gap of $9.95 per hour.
We calculated what that gap has cost the average worker. According to the Current Employment Statistics (Establishment Survey), produced by the Bureau of Labor Statistics, the average weekly hours of production and nonsupervisory employees for private sector employers in 2017 was 33.6 hours.
33.6 hours per week x 52 weeks = 1,747.2 annual hours worked
1,747.2 annual hours x $9.95 per hour in lost wages = $17,385 in lost annual pay
In 2017 alone, then, the average worker lost $17,385--because wages have not kept up with productivity.
In July 2017, the Bureau of Labor Statistics reported the total number of production and nonsupervisory employees to be 102.5 million workers.
$17,385 x 102,500,000 workers = $1,781,962,500,000 in lost income for workers
Which means--in 2017 alone--the total amount of income lost to all production and nonsupervisory workers was $1.78 trillion.
Where did that money go?
Basically, corporate profits have been soaring. In the chart below, based on data from the Bureau of Economic Analysis, this tremendous rise in corporate profits becomes apparent.
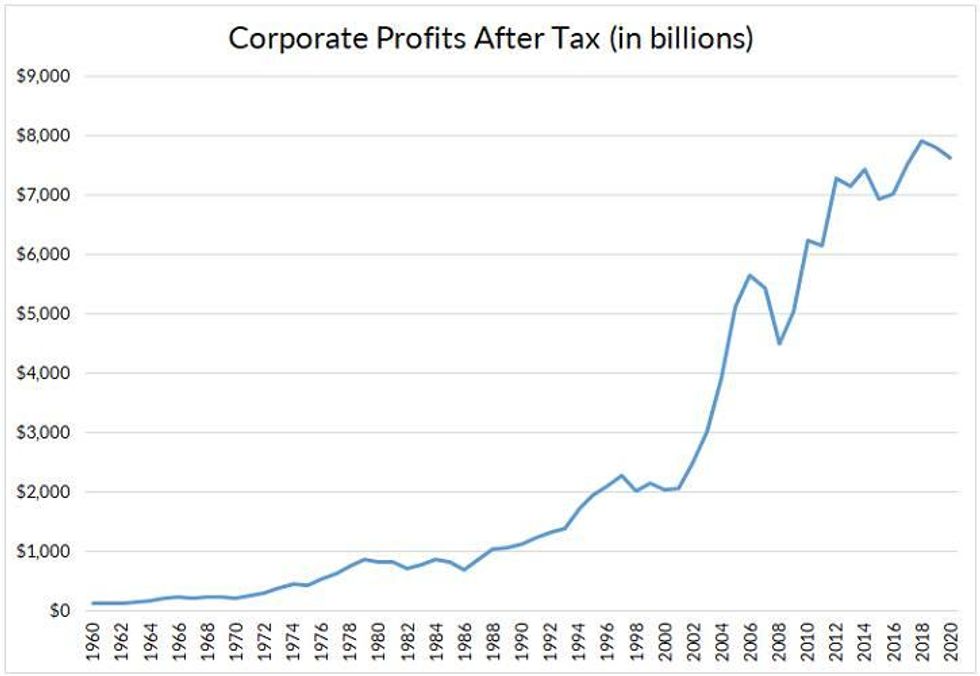
So companies have been paying employees an increasingly smaller share of the value their labor produces, which is another way of seeing what the productivity-wage gap already showed us. But there are many things corporations can do with profits, and they usually don't hoard the money in corporate bank accounts.
What did they do with the extra wealth they were extracting from their workers? Partly, they increased dividend payments to shareholders.
In 2017 alone, dividends paid by U.S. businesses totaled $1.5 trillion. Between 1979 and 2020, domestic corporations paid shareholders $27 trillion.
Here's the productivity and worker-pay chart from EPI again, but with annual corporate dividends added:
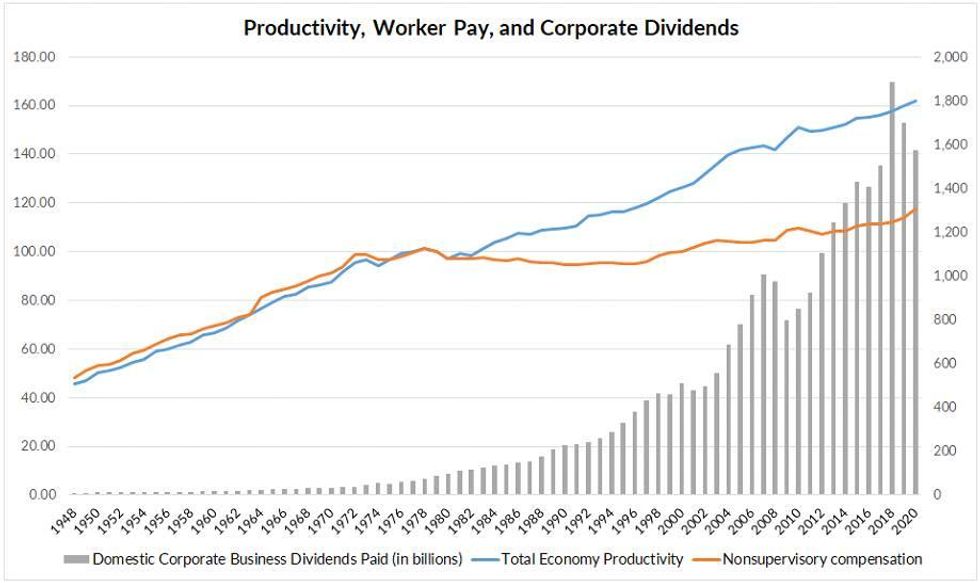
The wealth workers should have received has, arguably, instead been given to shareholders through dividends--a mechanism which functions like an upward distribution of wealth.
Of the $1.8 trillion not paid to workers in 2017, $1.5 trillion went to shareholders instead.
But aren't a lot of workers also shareholders? In a sense, aren't they just getting their money another way? Not really, according to the data.
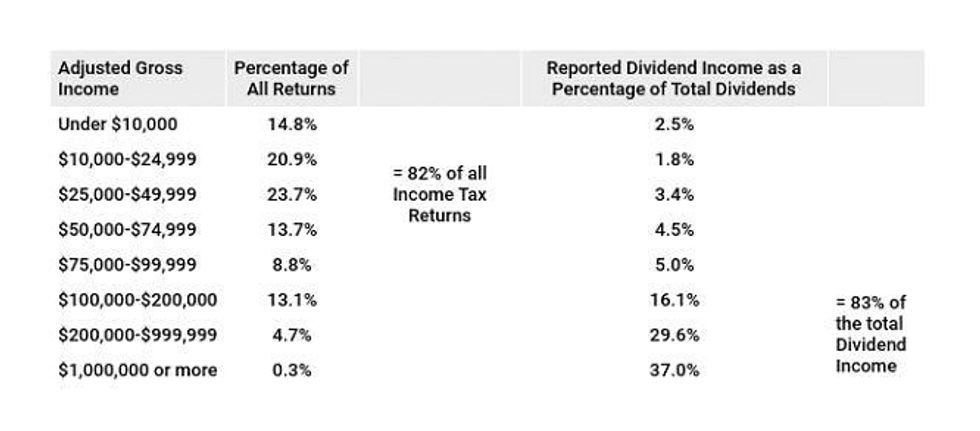
For the 2017 tax year, aggregate data from the IRS shows that 83% of dividends went to filers with an adjusted gross income of more than $100,000--roughly the top 18% of filers.
What's more, 37% of all dividend income went to the top 0.3% of filers--those who took home more than $1 million.
These individual tax filings don't account for the dividends given to institutional investors--the primary shareholders of publicly traded companies, which include financial management companies and pension funds. Of course, some workers could, eventually, receive some of this dividend income through their pensions, though pensions are becoming relatively rare. A similar argument could be made regarding other retirement plans, like 401(k)s and individual retirement accounts, but these accounts mostly help the wealthy--the richest 10% of Americans own 84% of the value of shares of stock.
The consequences of this massive upward wealth transfer are enormous, which has turbocharged the domination of our political system by corporations and the wealthy. Excessive corporate profits have even contributed to the higher rate of inflation over the past year. Meanwhile, total household debt has increased as workers take out loans to cover the wages they used to get.
Inequality Increases as Union Density Decreases
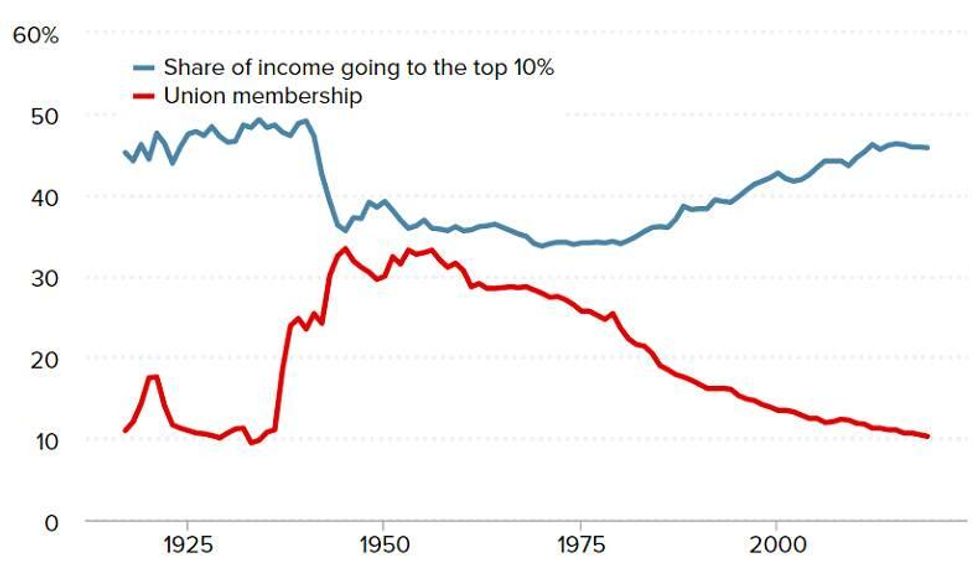
This next chart from EPI shows the rise and fall of union membership over the past century, as the percentage of all workers who are union members. It also tracks the share of income going to the top 10% of earners.
An inverse relationship between the two quickly becomes apparent: As union membership goes up, the income share to the top 10% goes down; when union membership goes down, the income share to the top 10% goes up.
As unions gained strength in the 1940s and could negotiate higher wages for more workers, the relative amount of income that went to the top 10% necessarily came down. Since the 1970s, as unions declined, the reverse has been true. As EPI calculates it, "deunionization explains a third of the growth of the wage gap between high- and middle-wage earners over the 1979 - 2017 period."
Labor's Share of National Wealth is Declining
The factors above have also contributed to labor's falling share of our gross domestic product--the sum of all goods and services produced in the United States.
The chart below, sourced from the University of Groningen and the University of California, Davis, tracks labor's share of GDP since 1950. The data includes managerial salaries and therefore somewhat overstates what we would consider "labor," but the trend line is clear.
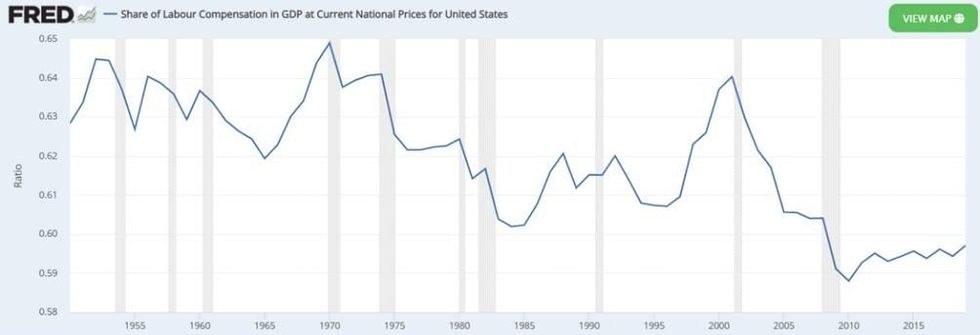
Labor's average share of GDP in the 1950s was 63.6%. In the 2010s, that share was 59.4%--a downward shift of 4.2 percentage points. (To be clear, the decline in union membership is only one of many causes for this shift.)
While a difference of 4.2 percentage points may seem small, the current GDP is $24 trillion--4.2% of that marks about $1 trillion of lost labor compensation each year. (While one might expect the difference to be roughly $1.8 trillion--the amount workers are losing in lost wages--the $800 billion difference is largely due to the inclusion of managerial salaries in the data, and the inclusion of various benefits in the calculation of labor's share of GDP.)
The Answer is More Worker Power
The Build Back Better Act would fund social investments by increasing taxes on corporations and the very, very wealthy, and by closing various tax loopholes. But those reforms are addressing only a symptom of the problem; they don't create a more equitable distribution of income. Spending per production/ nonsupervisory worker under the Build Back Better Act would be less than $1,800 per year--a tenth of the additional income workers should be seeing each year.
From 1948 to 1979, when union density in the United States was higher, productivity growth and wage growth were nearly equal. During that same period, corporate profits and dividends were very low. Worker power--as seen in high levels of unionization--ensured that workers took home a larger share of the wealth they created. Imagine how different the United States would be today if the working class had received, since 1979, the trillions of dollars that has instead gone to shareholders.
The best way to "strengthen the middle class," as President Joe Biden has framed the Build Back Better agenda, is to increase workers' ability to share in the wealth they create. There are some policy tools that would encourage a more equitable distribution of income--such as reinstating a very high marginal tax rate on the highest incomes, highly taxing or limiting shareholder dividends, or reinstating the prior ban on corporate share repurchases. But we're unlikely to win policies that meaningfully raise taxes on the wealthy or interfere with dividend payments while our current political parties see no upside for themselves in a realignment of economic power.
The most effective way to ensure the equitable distribution of income is to increase worker power. The Protecting the Right to Organize Act, or PRO Act, would strengthen the ability of workers to form and join unions and passed the House in March 2021--but has since languished in committee in the Senate.
Workers themselves must rebuild the power they once held. Union membership has again declined this past year, according to the most recent data from the Bureau of Labor Statistics, but there are also encouraging signs of worker organizing and militancy. Workers at John Deere won 10% raises after a five week strike, and Kellogg's workers struck for 11 weeks to fight off a permanent two-tiered wage system. Since the first Starbucks Workers United win in Buffalo, N.Y., workers from at least 23 other Starbucks locations in 13 states have filed election petitions.
It's time for unions to invest much more in new worker organizing--and harness the power of an active, engaged and militant membership.
The fate of the Build Back Better Act is currently unknown. The bill would be the largest social spending achievement in decades and provide needed services and support to millions of families--with more than half of the proposed $1.75 trillion in spending going to child care, preschool, affordable housing, higher education and healthcare.
But this proposed spending, over 10 years, is barely noticeable compared with the wages workers have lost over the past 40 years. In terms of productivity, wages should be significantly higher than they are, and the average worker continues to be shortchanged thousands of dollars annually. And much of the money workers should be getting is instead being pumped up to the top 0.3% of income earners.
How Much Money Have Workers Lost?
The following chart from the Economic Policy Institute (EPI), an independent think tank, shows the growing gap between productivity and worker pay since 1979, during which productivity grew 3.5 times as much as pay.
A number of factors have contributed to this productivity-wage gap. According to EPI, starting in the late 1970s, more unemployment has been tolerated to reduce inflation, the federal minimum wage has been raised less often, the deregulation of a number of industries has kept wages lower, corporate globalization has increased, wage theft has grown, and labor laws have failed to stop growing employer hostility toward unions. As unions declined, they had less power in their industries and therefore less ability to negotiate better wages to capture productivity gains.
In the chart, the line tracking productivity soars while the line tracking wages stagnates. As the two diverge, income inequality increases.
Less explored than the causes of the productive-wage gap is how much this gap is actually costing workers in real dollars--and where that lost income is going instead. As EPI's Lawrence Mishel and Josh Bivens calculate, if wages had kept pace with productivity, then the median hourly wage (adjusted for inflation) in 2017 would have been $33.10. The actual median hourly wage in 2017 was $23.15, a gap of $9.95 per hour.
We calculated what that gap has cost the average worker. According to the Current Employment Statistics (Establishment Survey), produced by the Bureau of Labor Statistics, the average weekly hours of production and nonsupervisory employees for private sector employers in 2017 was 33.6 hours.
33.6 hours per week x 52 weeks = 1,747.2 annual hours worked
1,747.2 annual hours x $9.95 per hour in lost wages = $17,385 in lost annual pay
In 2017 alone, then, the average worker lost $17,385--because wages have not kept up with productivity.
In July 2017, the Bureau of Labor Statistics reported the total number of production and nonsupervisory employees to be 102.5 million workers.
$17,385 x 102,500,000 workers = $1,781,962,500,000 in lost income for workers
Which means--in 2017 alone--the total amount of income lost to all production and nonsupervisory workers was $1.78 trillion.
Where did that money go?
Basically, corporate profits have been soaring. In the chart below, based on data from the Bureau of Economic Analysis, this tremendous rise in corporate profits becomes apparent.
So companies have been paying employees an increasingly smaller share of the value their labor produces, which is another way of seeing what the productivity-wage gap already showed us. But there are many things corporations can do with profits, and they usually don't hoard the money in corporate bank accounts.
What did they do with the extra wealth they were extracting from their workers? Partly, they increased dividend payments to shareholders.
In 2017 alone, dividends paid by U.S. businesses totaled $1.5 trillion. Between 1979 and 2020, domestic corporations paid shareholders $27 trillion.
Here's the productivity and worker-pay chart from EPI again, but with annual corporate dividends added:
The wealth workers should have received has, arguably, instead been given to shareholders through dividends--a mechanism which functions like an upward distribution of wealth.
Of the $1.8 trillion not paid to workers in 2017, $1.5 trillion went to shareholders instead.
But aren't a lot of workers also shareholders? In a sense, aren't they just getting their money another way? Not really, according to the data.
For the 2017 tax year, aggregate data from the IRS shows that 83% of dividends went to filers with an adjusted gross income of more than $100,000--roughly the top 18% of filers.
What's more, 37% of all dividend income went to the top 0.3% of filers--those who took home more than $1 million.
These individual tax filings don't account for the dividends given to institutional investors--the primary shareholders of publicly traded companies, which include financial management companies and pension funds. Of course, some workers could, eventually, receive some of this dividend income through their pensions, though pensions are becoming relatively rare. A similar argument could be made regarding other retirement plans, like 401(k)s and individual retirement accounts, but these accounts mostly help the wealthy--the richest 10% of Americans own 84% of the value of shares of stock.
The consequences of this massive upward wealth transfer are enormous, which has turbocharged the domination of our political system by corporations and the wealthy. Excessive corporate profits have even contributed to the higher rate of inflation over the past year. Meanwhile, total household debt has increased as workers take out loans to cover the wages they used to get.
Inequality Increases as Union Density Decreases
This next chart from EPI shows the rise and fall of union membership over the past century, as the percentage of all workers who are union members. It also tracks the share of income going to the top 10% of earners.
An inverse relationship between the two quickly becomes apparent: As union membership goes up, the income share to the top 10% goes down; when union membership goes down, the income share to the top 10% goes up.
As unions gained strength in the 1940s and could negotiate higher wages for more workers, the relative amount of income that went to the top 10% necessarily came down. Since the 1970s, as unions declined, the reverse has been true. As EPI calculates it, "deunionization explains a third of the growth of the wage gap between high- and middle-wage earners over the 1979 - 2017 period."
Labor's Share of National Wealth is Declining
The factors above have also contributed to labor's falling share of our gross domestic product--the sum of all goods and services produced in the United States.
The chart below, sourced from the University of Groningen and the University of California, Davis, tracks labor's share of GDP since 1950. The data includes managerial salaries and therefore somewhat overstates what we would consider "labor," but the trend line is clear.
Labor's average share of GDP in the 1950s was 63.6%. In the 2010s, that share was 59.4%--a downward shift of 4.2 percentage points. (To be clear, the decline in union membership is only one of many causes for this shift.)
While a difference of 4.2 percentage points may seem small, the current GDP is $24 trillion--4.2% of that marks about $1 trillion of lost labor compensation each year. (While one might expect the difference to be roughly $1.8 trillion--the amount workers are losing in lost wages--the $800 billion difference is largely due to the inclusion of managerial salaries in the data, and the inclusion of various benefits in the calculation of labor's share of GDP.)
The Answer is More Worker Power
The Build Back Better Act would fund social investments by increasing taxes on corporations and the very, very wealthy, and by closing various tax loopholes. But those reforms are addressing only a symptom of the problem; they don't create a more equitable distribution of income. Spending per production/ nonsupervisory worker under the Build Back Better Act would be less than $1,800 per year--a tenth of the additional income workers should be seeing each year.
From 1948 to 1979, when union density in the United States was higher, productivity growth and wage growth were nearly equal. During that same period, corporate profits and dividends were very low. Worker power--as seen in high levels of unionization--ensured that workers took home a larger share of the wealth they created. Imagine how different the United States would be today if the working class had received, since 1979, the trillions of dollars that has instead gone to shareholders.
The best way to "strengthen the middle class," as President Joe Biden has framed the Build Back Better agenda, is to increase workers' ability to share in the wealth they create. There are some policy tools that would encourage a more equitable distribution of income--such as reinstating a very high marginal tax rate on the highest incomes, highly taxing or limiting shareholder dividends, or reinstating the prior ban on corporate share repurchases. But we're unlikely to win policies that meaningfully raise taxes on the wealthy or interfere with dividend payments while our current political parties see no upside for themselves in a realignment of economic power.
The most effective way to ensure the equitable distribution of income is to increase worker power. The Protecting the Right to Organize Act, or PRO Act, would strengthen the ability of workers to form and join unions and passed the House in March 2021--but has since languished in committee in the Senate.
Workers themselves must rebuild the power they once held. Union membership has again declined this past year, according to the most recent data from the Bureau of Labor Statistics, but there are also encouraging signs of worker organizing and militancy. Workers at John Deere won 10% raises after a five week strike, and Kellogg's workers struck for 11 weeks to fight off a permanent two-tiered wage system. Since the first Starbucks Workers United win in Buffalo, N.Y., workers from at least 23 other Starbucks locations in 13 states have filed election petitions.
It's time for unions to invest much more in new worker organizing--and harness the power of an active, engaged and militant membership.