January, 09 2024, 12:52pm EDT

Tax Systems in 44 States Exacerbate Inequality, In-Depth ‘Who Pays?’ Study Finds
The vast majority of state and local tax systems are upside-down, with the wealthy paying a far lesser share of their income in taxes than low- and middle-income families. That’s according to the latest edition of the Institute on Taxation and Economic Policy’s Who Pays?, the only distributional analysis of tax systems in all 50 states and the District of Columbia.
This is largely driven by weak or nonexistent personal income taxes in many states. In those states, much of the income of the very wealthy avoids tax altogether, and there is a larger reliance on more regressive taxes like sales and excise taxes. Meanwhile, progressivity at the bottom of state and local tax codes is being largely driven by strong and refundable state credits, like Child Tax Credits and Earned Income Tax Credits.
“When you ask people what they think a fair tax code looks like, almost nobody says we should have the richest pay the least. And yet when we look around the country, the vast majority of states have tax systems that do just that,” says Carl Davis, ITEP’s Research Director. “There’s an alarming gap here between what the public wants and what state lawmakers have delivered.”
Other key findings:
- Tax systems in 44 states exacerbate inequality by making incomes more unequal after collecting state and local taxes, while systems in six states plus D.C. reduce inequality.
- On average, the lowest-income 20 percent of taxpayers face a state and local tax rate nearly 60 percent higher than the top 1 percent of households. The nationwide average effective state and local tax rate is 11.4 percent for the lowest-income 20 percent of individuals and families, 10.5 percent for the middle 20 percent, and 7.2 percent for the top 1 percent.
- In all, 42 states tax the top 1 percent less than every other income group. Similarly, 41 tax the top 1 percent less than the bottom 20 percent, and 46 tax the top 1 percent less than the middle 20 percent.
- Most (36) states tax their poorest residents at a higher rate than any other group.
- The 10 most regressive states are (in order of most to least regressive): Florida, Washington, Tennessee, Pennsylvania, Nevada, South Dakota, Texas, Illinois, Arkansas, Louisiana.
- The 10 least regressive jurisdictions are (starting with least): D.C., Minnesota, Vermont, New York, New Jersey, California, Maine, Massachusetts, New Mexico, Oregon. (The first seven of these have tax systems that are not regressive and therefore do not worsen inequality.)
A mix of recent policy changes have worsened, or alleviated, regressivity in state tax systems, depending on the choices made by lawmakers. This edition of Who Pays? shows what the distribution of some states’ taxes would look like if certain policy changes had not been made, as well as what they would look like today if future planned changes had already taken effect.
Some of these changes are dramatically reshaping the landscape of state tax law.
For instance, by undoing a 2020 voter-approved tax increase on the wealthy and then cutting income taxes instead, Arizona’s recent changes have led it to drop to 13th most regressive from what would have been 27th—had the voters’ will been heeded and no further tax changes made. And a flurry of tax cuts enacted since 2017 have dropped Kentucky to 17th most regressive from 30th. Tax cutting in the Bluegrass state is ongoing and, if fully implemented, will eventually drop Kentucky to 8th most regressive.
On the other side of the coin, Massachusetts has risen to 8th least regressive from 18th, thanks to its 2022 voter-approved tax increase on high-income households and 2023 expansions of refundable tax credits for low- and moderate-income families. And New Mexico since 2018 has risen to the 9th least regressive from 27th after a range of progressive tax changes, including a new Child Tax Credit, an expansion to the Earned Income Tax Credit, and tax increases on capital gains and top incomes.
“We’ve seen a lot of states shift their tax systems to become even more regressive in recent years by enacting deep tax cuts for the wealthiest. But we know it doesn’t have to be like this. There is a clear path forward for flipping upside-down tax systems and we’ve seen a handful of states come pretty close to pulling it off,” said Aidan Davis, ITEP’s State Policy Director. “The regressive state tax laws we see today are a policy choice, and it’s clear there are better choices available to lawmakers.”
About the report:
Who Pays? is the only distributional analysis of tax systems in all 50 states and the District of Columbia. The comprehensive 7th edition of the report assesses the progressivity and regressivity of state tax systems by measuring effective state and local tax rates paid by all income groups. No two state tax systems are the same; this report provides detailed analyses of the features of every state tax code. It includes state-by-state profiles that provide baseline data to help lawmakers and the public understand how current tax policies affect taxpayers at all income levels. Over 99 percent of all state and local taxes, measured by their revenue contribution, are included in the analysis.
Founded in 1980, the Institute on Taxation and Economic Policy (ITEP) is a non-profit, non-partisan research organization, based in Washington, DC, that focuses on federal and state tax policy. ITEP's mission is to inform policymakers and the public of the effects of current and proposed tax policies on tax fairness, government budgets, and sound economic policy. ITEP's full body of research is available at www.itepnet.org.
LATEST NEWS
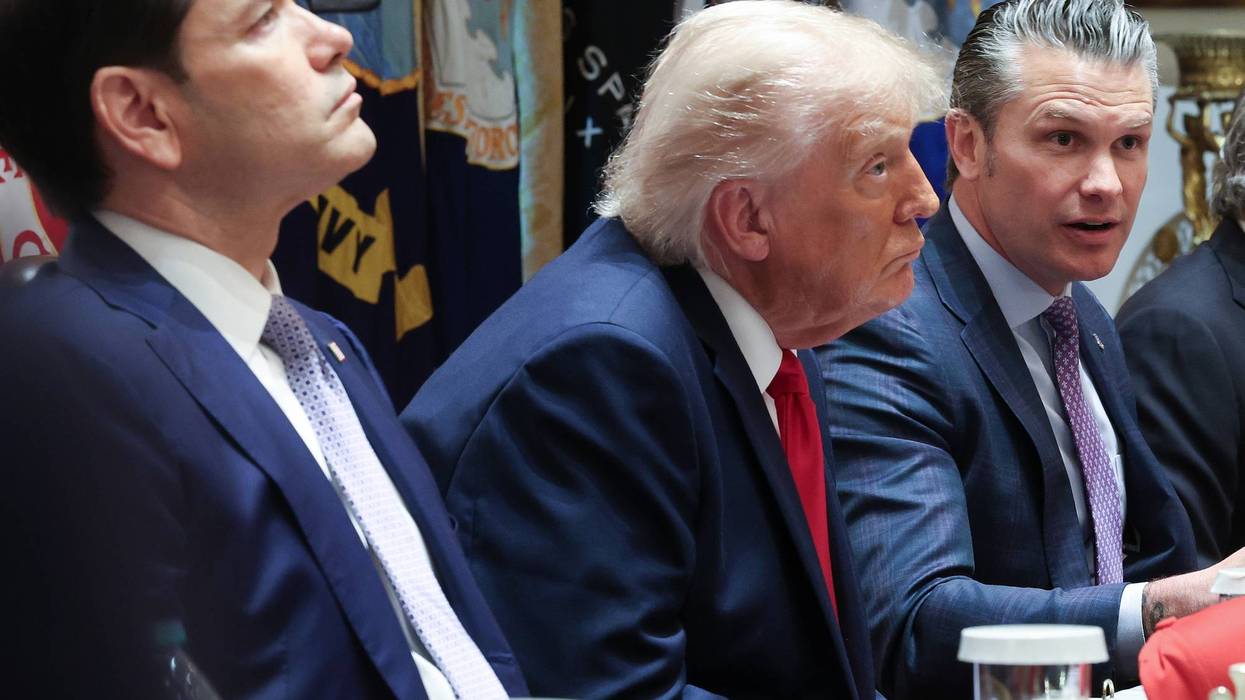
In 'Most Serious Test Yet' of Ceasefire Deal, Trump Bombs Iran After Strike on Cargo Ship in Strait
The US attack came as Secretary of State Marco Rubio announced a trilateral agreement with Israel and Lebanon, which Israeli forces have bombed and occupied throughout the Iran War.
Jun 26, 2026
US President Donald Trump resumed bombing Iran on Friday, a day after an Iranian attack on a cargo ship in the Strait of Hormuz, elevating concerns about the future of a ceasefire agreement just as Israel and Lebanon signed a related deal.
The Trump administration—which partnered with Israel to launch an illegal war on Iran in late February—and the Iranian government agreed on a memorandum of understanding (MOU) earlier this month. On Thursday, Iran attacked the Singapore-flagged commercial vessel, the Ever Lovely, in the strait, a key trade waterway.
"The Islamic Republic of Iran shot at least four One Way Attack Drones at Ships transversing the Strait of Hormuz," Trump wrote on his Truth Social platform Friday morning. "One of the Drones solidly hit the upper deck of a large and very expensive Cargo Carrying Ship. Damage was done, but the Ship was able to proceed on its way. We knocked down three other Drones. Obviously, this is a foolish violation of our Ceasefire Agreement."
Responding on the social media network X, Ebrahim Azizi, who heads the Iranian Parliament's Commission on National Security and Foreign Policy, said: "The reality in the Persian Gulf has changed. The Strait of Hormuz is governed by Iran, so: Respect the rules. Use secure routes. Do not mistake control for escalation. If you do not learn the rules, the Iranian armed forces will teach them to you. This is not a violation of the ceasefire; it is ceasefire management."
Later Friday, US Central Command (CENTCOM) announced that "as a powerful response to yesterday's attack on a commercial ship that was transiting the Strait of Hormuz," American aircraft "struck Iranian missile and drone storage locations and coastal radar sites."
"The unwarranted aggression against commercial shipping by Iranian forces clearly violated the ceasefire," CENTCOM said. "Furthermore, Iran's dangerous behavior undermined freedom of navigation as commerce increasingly flows through the vital international trade corridor."
"CENTCOM forces continue to provide safe passage coordination and support to commercial vessels transiting the strait," Central Command added. "The US military remains present and vigilant to ensure all aspects of the agreement with Iran are adhered to, obeyed, and in full force and effect."
Flagging CENTCOM's announcement, the National Iranian American Council (NIAC) pointed out that "this marks the first publicly acknowledged US military action against Iran since the recent ceasefire agreement, potentially representing the most serious test yet of the fragile understanding between Tehran and Washington."
"Notably, the alleged violation of the MOU resulted in military retaliation," NIAC added, "contra coordination via the executive mechanism that was supposed to be established to monitor implementation of the deal."
Al Jazeera reported late Friday that Iran's Islamic Revolutionary Guard Corps (IRGC) released a statement saying it has responded with fire:
The IRGC said its Navy targeted locations in the region where US forces are deployed, without specifying where or providing additional details.
It condemned the US strikes on Iran, saying Washington, "as always, violated its commitments and launched an airstrike” on the Iranian coast.
"According to Article 5 of the memorandum of understanding, Islamabad has arrangements for controlling traffic in the Strait of Hormuz with the Islamic Republic of Iran," the IRGC said.
"However, the US, by inciting various parties, sought to violate this commitment, which was met with the necessary response," the statement continued. "If the aggression is repeated, our response will be more extensive."
As for the administration's supposedly diplomatic efforts, US Secretary of State Marco Rubio announced that the United States, Israel, and Lebanon—which Israeli forces have been bombing throughout the Iran War—had signed a trilateral framework that he claimed "builds a realistic path out of endless conflict."
"This agreement establishes a clear and structured process to restore Lebanon’s sovereignty, disarm Hezbollah, and dismantle its terrorist infrastructure, and enable Israel to return to its borders once that threat to its citizens is removed," Rubio said. "It also creates a trilateral Military Coordination Group for Lebanon (MCG4L), facilitated by the United States, allowing the two sides to implement this framework. For Lebanon, this framework provides a genuine pathway out of a long crisis. For Israel, it creates a verifiable path to removing the persistent threat on its northern border."
The framework was met with protests in the Lebanese capital. Lebanon's National News Agency reported that Hezbollah supporters gathered on motorcycles in Beirut to oppose the deal.
Keep ReadingShow Less
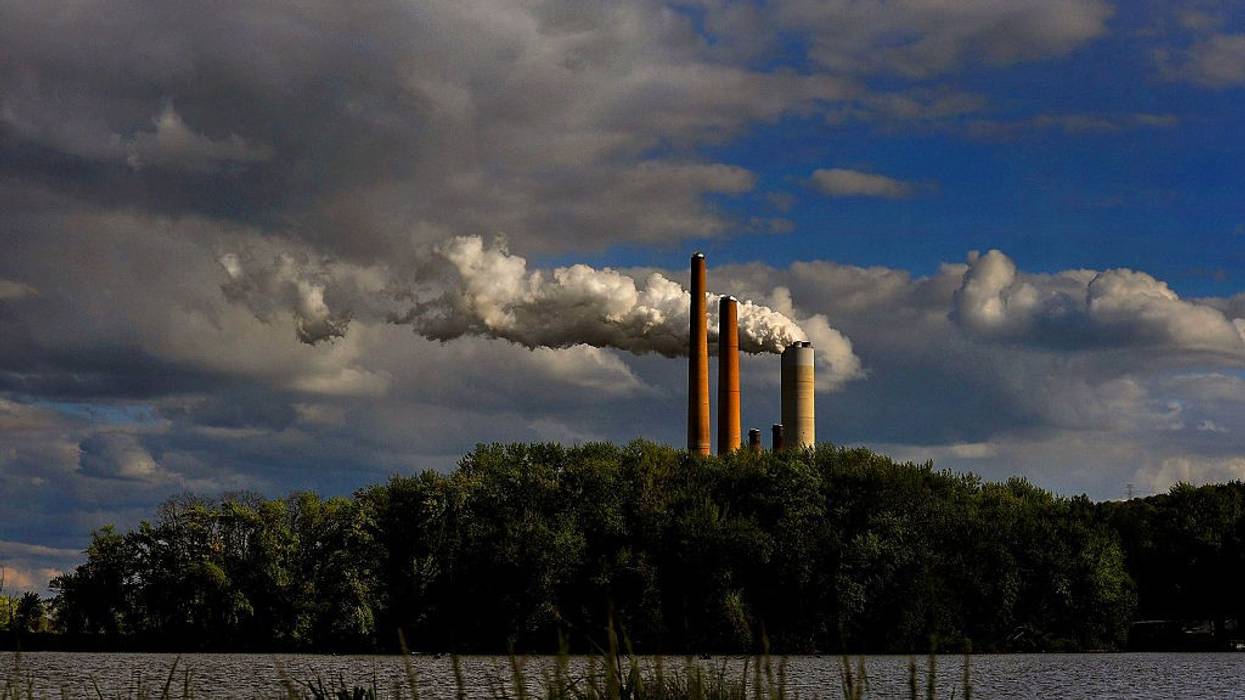
'Good News for Clean Air' as Court Rejects Trump EPA Bid to Ditch Coal Plant Soot Rule
"The court’s rejection of the Trump administration’s attempt to eliminate our national health standards for soot will mean healthier, longer lives for people across the country," said one advocate.
Jun 26, 2026
A federal appeals court on Friday rejected the US Environmental Protection Agency's attempt to scrap a Biden-era rule tightening limits on harmful soot pollution spewed from coal-fired power plants and other sources.
In a unanimous ruling, a three-judge panel of the US Court of Appeals for the District of Columbia Circuit dealt a blow to President Donald Trump's deregulatory agenda by leaving intact a national soot standard enacted in 2024 that lowers the amount of fine particulate matter from power plants, factories, and vehicles from 12 to 9 micrograms per cubic meter.
"Soot, made up of tiny toxic particles that lodge deep in the lungs, results in severe health harms, including premature death, and comes from sources like vehicle exhaust pipes, power plants, and factories," the legal advocacy group Earthjustice explained.
The Environmental Protection Agency (EPA) under Administrator Lee Zeldin last year asked the appellate court to invalidate the soot rule, claiming that the Biden administration exceeded its authority and failed to take into account the economic cost of implementing the policy.
“Clean air is not a luxury. We are thrilled these vital air quality standards have been upheld by a federal court,” said Patrice Simms, vice president of Healthy Communities at Earthjustice. “The 2024 soot standard is a critical advancement for public health, projected to save thousands of lives every year. Lee Zeldin’s EPA must stop catering to polluters and must instead fulfill its mission to protect public health. The time for implementing the 2024 soot standard is now.”
Clean Air Task Force senior director of legal advocacy Shaun Goho also welcomed the ruling, saying: "Fine particulate matter standards provide critical public health protections. The court correctly rejected EPA’s about-face on the need for a stronger standard."
Katie Huffing, executive director of the Alliance of Nurses for Healthy Environments, called Friday's decision "a win for public health."
“Every day in practice, nurses witness and treat conditions made worse by soot pollution," she said. "From asthma exacerbations and chronic obstructive pulmonary disease to heart disease and preterm birth, nurses see the real-world health implications of toxic air pollution."
"The science shows stronger limits to reduce dangerous soot pollution provide significant health benefits for Americans, especially for those most vulnerable and those exposed to higher levels of particulate matter pollution," Huffing added. "We now urge EPA to fully implement the strengthened standard to ensure those health benefits are realized.”
Noha Haggag, senior attorney for the Environmental Defense Fund, said that “today’s federal court decision is good news for clean air in America and for the millions of people harmed by deadly soot."
“Soot can cause asthma attacks, lung cancer, and premature deaths," Haggag added. "The court’s rejection of the Trump administration’s attempt to eliminate our national health standards for soot will mean healthier, longer lives for people across the country.”
Keep ReadingShow Less
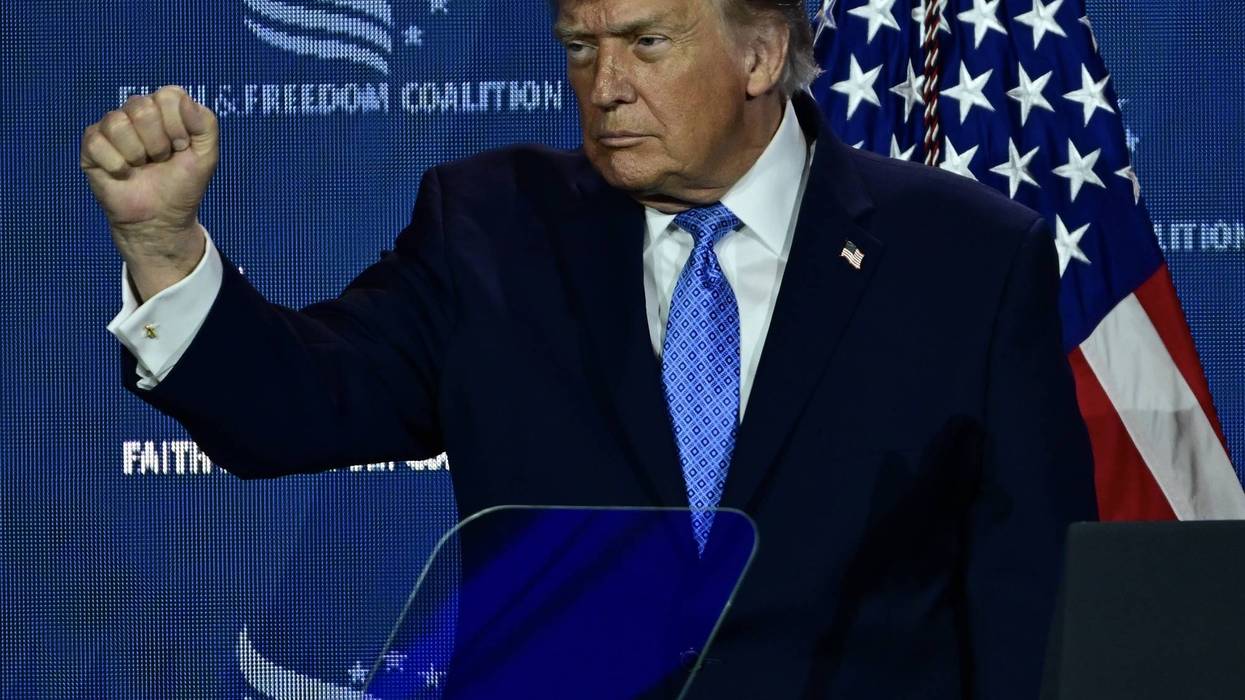
Unhinged Trump Calls US Progressives Communist 'Animals' Who Will 'Close Your Churches' and 'Kill Your People'
The president complained about primary victories of progressives backed by New York City's democratic socialist mayor, who this week secured a rent freeze for a million units and put $15 million toward gender-affirming care.
Jun 26, 2026
After a series of electoral victories for democratic socialists and legal blows to President Donald Trump's authoritarian agenda this week, the Republican on Friday ranted to a Christian conference that progressives—whom he called "hardcore, godless communists"—are "the most serious threat to our country since its existence, in my opinion, 250 years ago."
Trump previewed his nearly 50-minute speech to the Faith and Freedom Coalition's policy conference with a lengthy post on his Truth Social platform in which he wrote: "I'd be the Greatest Communist in History. I'd give free rent, free houses, free food, everything is free. Unfortunately, after two or three years, the Country where this is taking place would fail. It always does, and then you'll start living in squalor. There will be no food, there will be no housing, there will be no Military, there will be no nothing."
In a signal that he was specifically targeting the left flank of the Democratic Party, Trump said: "They're animals! In many cases, not smart but, in some cases, they are. It's easy for them to get followers because they make promises that they know they can't keep, and the Dumocrats aren't fighting back. In many ways, they're allowing them to go their own way. They’re afraid they will lose their Election, they're afraid of conflict. They’re not smart enough or tough enough to fight this plague."
"These are not social Dumocrats, these are hardcore, godless Communists," the president continued. "Isn't it ironic, we're celebrating a very important Birthday, and instead of speaking about Christ, Freedom, and Victories of all different kinds, we're speaking about yet another threat to the Foundations of America. These ruthless Communists will attack all Religions but, in particular, Christianity—They always do. All Communist Countries attack Religions violently."
"As you know, we recently struck Nigeria, and largely ended the slaughter of their Great Christian population," he added. "They know that if they go further, the attack will be far greater and, in that, they don't want to get involved. I am saving Christians throughout the World, even though we are not in those various Countries, by hitting these Terrorists violently and hard. They will close your Churches, they will kill your people. This is what they're about."
During the actual speech, Trump specifically took aim at "the communists elected in New York City recently," who he claimed "want to completely destroy the traditional American way of life," an apparent jab at a slate of candidates who won their Democratic primaries earlier this week: Claire Valdez in New York’s 7th Congressional District, Brad Lander in the 10th District, and Darializa Avila Chevalier in the 13th District.
By contrast, US Sen. Bernie Sanders (I-Vt.), a democratic socialist who ran for president in 2016 and 2020, called the trio's victories proof that Americans "are sick and tired of status quo politics" and "want to end the corrupt campaign finance system, which enables billionaires to spend huge amounts of money to elect candidates who will represent their interests and go to war against working-class people."
All three campaigned on progressive policies including more affordable housing, Medicare for All, stronger union protections, and an end to US military support for Israel’s genocidal assault on Palestinians—and they were backed by New York City Mayor Zohran Mamdani, a democratic socialist who continued delivering on his campaign promises on Thursday, when the NYC Rent Guidelines Board approved a two-year rent freeze affecting roughly a million apartments.
While Trump complained about that NYC development in his Friday speech, others have celebrated it. Melanie D'Arrigo, executive director of the Campaign for New York Health, which advocates for universal single-payer healthcare, said that "the real threat Zohran Mamdani poses is to the career politicians who've spent decades making promises, then making excuses, then telling people to vote harder next time. He's showing people that elected officials can actually do things that help them in their everyday lives."
Shortly before Trump's swipe at the New York progressives running for Congress, he claimed that left-leaning Democrats "want to resume the transgender 'mutilization' of our children." In addition to attacking lifesaving gender-affirming healthcare for trans youth, the president has restricted abortion access and signed legislation that's already led to millions losing insurance coverage.
Meanwhile, Mamdani on Friday announced a $15 million plan to expand access to gender-affirming care for youth and adults across the city, which includes a direct care access fund, a call and text line, and funding for research. He said that "as the federal government attacks transgender people and attempts to intimidate patients, families, and providers, New York City is stepping up."
Despite Trump's claim that the Democratic Party establishment isn't fighting back against ascendant progressives and democratic socialists, Axios reporting from Thursday suggests centrist Democrats are, in fact, gearing up to do so—and over a dozen have endorsed the "Promise to America" manifesto, emphasizing their support for capitalism, "fiscal discipline," and law enforcement.
Ripping the manifesto, D'Arrigo said: "'Centrism' is just performative compromise devoid of critical thinking, policy, or ideology. It’s a political vehicle that gives permission to do nothing in service of protecting a status quo that benefits large corporate donors and special interest groups who fund both parties."
In addition to serving the corporate interests that bankrolled his return to power, Trump has also served himself during his second term, growing the wealth of his family by billions of dollars and even accepting a luxury plane from Qatar.
Trump has also made a range of other moves that demonstrate his contempt for US law—from pardoning donors and other supporters, including insurrectionists who stormed the US Capitol, to weaponizing the Department of Justice against his enemies, to carrying out multiple illegal military actions, such as his invasion of Venezuela and abduction of its president, the ongoing war on Iran, and deadly bombings of boats his administration claims were trafficking drugs.
The president's violent and authoritarian agenda has faced some setbacks in court this week: Federal judges ruled against the administration's policy pushing US Immigration and Customs Enforcement (ICE) arrests at courthouses, as well as a pair of Trump executive orders that attacked voting rights.
However, those cases are ongoing, plus another federal judge issued lengthy prison sentences for a group of activists who protested outside an ICE detention center and were falsely accused by the administration of being members of a nonexistent "North Texas Antifa Cell." Trump has also continued his assault on voting rights this week, scrapping plans to sign a bipartisan housing bill in a bid to pressure Congress to pass the so-called Safeguard American Voter Eligibility Act.
With the November elections just over four months away, Ron Filipkowski, editor-in-chief of MeidasTouch, also took Trump's Friday Truth Social comments as a threat, saying, "This sounds a lot to me like Trump laying the groundwork to steal the midterms."
Keep ReadingShow Less
Most Popular