

SUBSCRIBE TO OUR FREE NEWSLETTER
Daily news & progressive opinion—funded by the people, not the corporations—delivered straight to your inbox.
5
#000000
#FFFFFF
To donate by check, phone, or other method, see our More Ways to Give page.

Newly available wage data tells a familiar story: In every period since 1979, wages for the bottom 90% were continuously redistributed upwards to the top 10% and frequently to the very highest 1.0% and 0.1%.
For last year, 2019, the data show a continuation, with annual wages rising fastest for those in the top 10% while those in the bottom 90% saw below-average wage growth.
This unceasing growth of wage inequality that undercuts wage growth for the bottom 90% reaffirms the need to place generating robust wage growth for the vast majority and rebuilding worker power at the center of economic policymaking.
A similar pattern as in 2019 prevailed over the entire 2007-19 business cycle as wages were redistributed in two ways, up from the bottom 90% to the top 10% and within the top 10% from the top 1% to those in the remaining 9% of the top 10%. Still, the top 1% has done far better in the 2009-19 recovery (wages rose 20.4%) than did those in the bottom 90% (wages rose only 8.7%).
As Figure A shows, the top 1% and the very tippy top, those in the top 0.1%, were the clear winners over the longer-term 1979-2019 period:
This disparity in wage growth reflects a sharp long-term rise in the share of total wages earned by those in the top 1.0% and 0.1%.
These are the results of EPI's updated series on wages by earning group, which is developed from published Social Security Administration (SSA) data and updates the wage series from 1947-2004 originally published by Kopczuk, Saez and Song (2010). These data, unlike the usual source of our other wage analyses (the Current Population Survey) allow us to estimate wage trends for the top 1.0% and top 0.1% of earners, as well as those for the bottom 90% and other categories among the top 10% of earners. These wage data are not top-coded, meaning the underlying earnings reported are actual earnings and not "capped" or "top-coded" for confidentiality. These SSA wage data are W-2 earnings which includes realized stock options and vested stock awards.
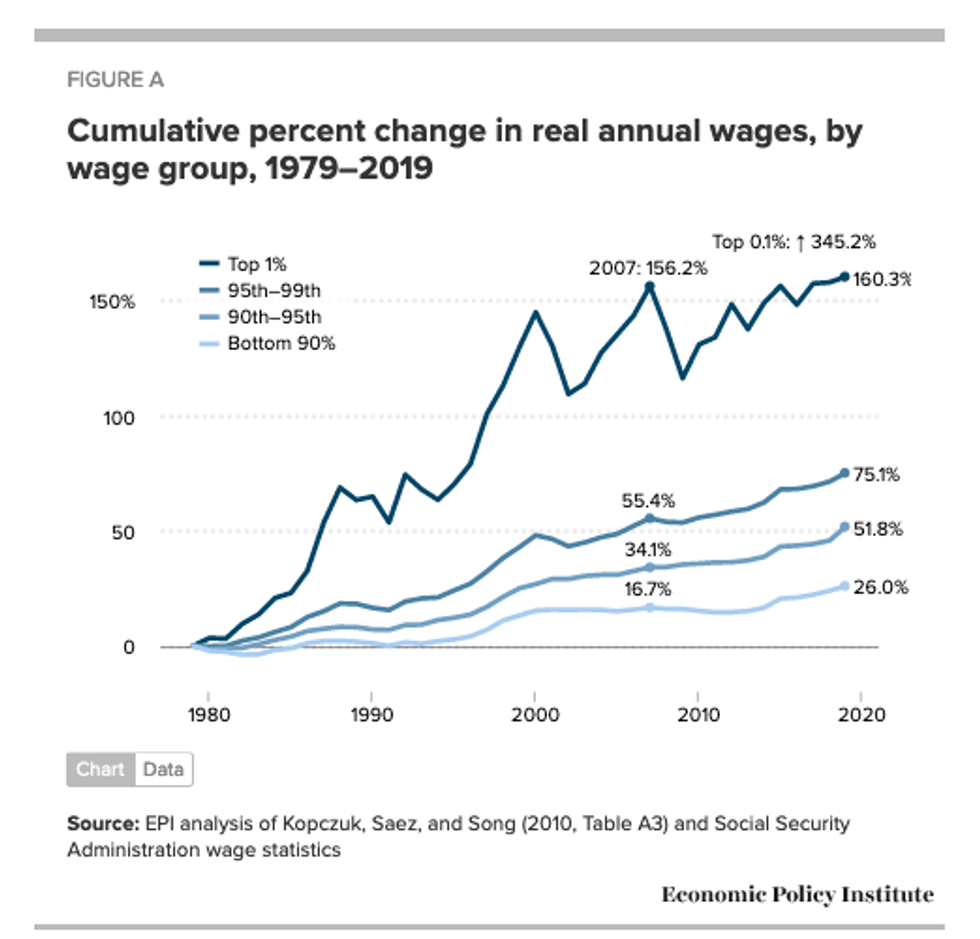
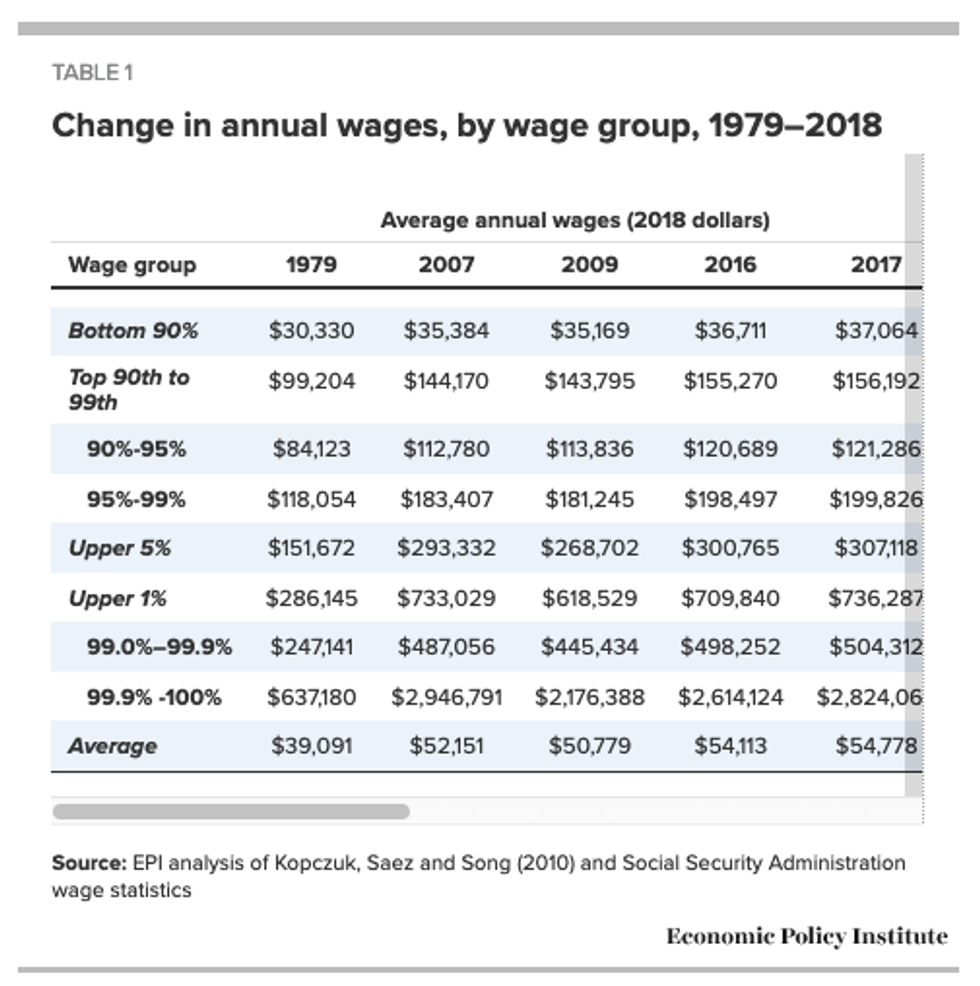
Over the longer-term, since 1979, there was far faster wage growth at the top (highest 1.0%) and tippy-top (upper 0.1%) signaling a major redistribution upwards from the bottom 90%. As Figure A shows, the top 1.0% of earners are now paid 160.3% more than they were in 1979. Even more impressive is that those in the top 0.1% had more than double that wage growth, up 345.2% since 1979 (Table 1). In contrast, wages for the bottom 90% only grew 26.0% in that time. The other segments of the top 10% (those in the 90-95th percentiles and the 95-99th percentiles) also had faster-than-average wage growth since 1979, up 51.8% and 75.1%, but nowhere near as fast as the wage growth at the top. Thus, wages have been redistributed upward since 1979 from the bottom 90% to the top 10% and within the top 10% to the top 1% and especially to the top 0.1%.
This pattern of wage upward wage distribution also prevailed over the recent recovery (since 2009): the bottom 90% experienced modest annual wage growth--reflecting growing annual hours as well as higher hourly wages--up 8.7% from 2009 to 2019. In contrast, the wages of the top 1.0% and top 0.1% grew, respectively, 20.4% and 30.3% in the last ten years.
In the most recent year, however, wages grew fastest for the bottom 9% of the top 10% (up 4.2% for 90-95th percentiles, up 2.2% for 95-99th percentiles) and slower than average for the bottom 90% (up 1.7%) and the top 0.1% and top 1% (both up 1.0%).
One key characteristic of the Great Recession downturn was the big hit on the very highest earners, with the top 1% and top 0.1% seeing 15.6% and 26.1% declines over the two years from 2007 to 2009. Even by 2019 the top 0.1% had not recovered from this sharp fall at the start of the business cycle as the top 1.0% as a whole earned only 1.6% above their 2007 earnings. Thus, the business cycle from 2007 to 2019 was one where wages were redistributed from the bottom 90% to the top 10% and within the top 10% from the top 1% to the remainder of the top 10% (the 90th to 99th percentiles). The one constant wage dynamic in every period since 1979 has been that the wages for the bottom 90% are continuously redistributed upwards.
It is worth noting that our series on the wage growth of the bottom 90% corresponds closely to the Social Security Administration's series on median annual earnings: between 1991 and 2019 the real median annual wage grew 23.8%, very close to the 26.0% growth for the bottom 90%.
It is also noteworthy that the wage growth for the bottom 90% was almost entirely concentrated in the two periods of sustained low unemployment representing 11 of the 40 years: the bottom 90%'s wage growth in the 1995-2000 and 2013-19 periods represented 90% of all the wage growth ($7,230 of $8,043) over the entire 1979-2019 period. The shift of wages away from the bottom 90% meant that their wages rose 26.0% rather than the 44.6% increase obtained on average over the 1979-2019 period, some 18.6 percentage points faster growth.
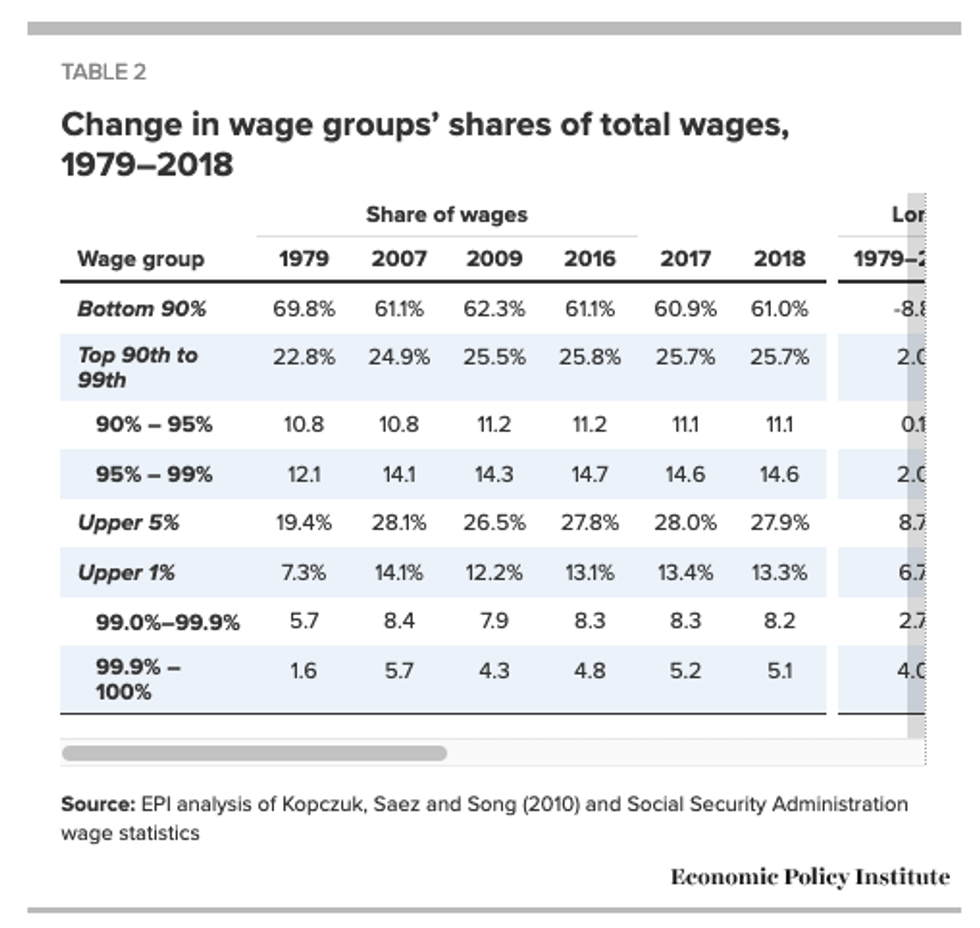
These disparities in long-term wage growth reflect a major redistribution upwards of wages since 1979, as noted earlier. The bottom 90% earned 69.8% of all earnings in 1979 but only 60.9% in 2019 (Table 2). In contrast the top 1.0% nearly doubled its share of earnings from 7.3% in 1979 to 13.2% in 2019. The growth of wages for the top 0.1% is the major dynamic driving the top 1.0% earnings as the top 0.1% more than tripled its earnings share from 1.6% in 1979 to 5.0% in 2019.
The bottom 90% lost some ground over the recent business cycle, 2007-19, as their wage share fell slightly from 61.1% to 60.9%. The winners in the recent business cycle were not the top 1% whose wage share fell from 14.1% to13.2%. Rather, the upward redistribution of wages from the bottom 90% and the shift away from the top 1.0% in the recent business cycle accrued to the other high earners in the top 10%, those earning between the 90th and 95th percentiles (averaging $129,998 in 2019) and between the 95th and 99th percentiles (averaging $210,511 in 2019).
Newly available wage data tells a familiar story: In every period since 1979, wages for the bottom 90% were continuously redistributed upwards to the top 10% and frequently to the very highest 1.0% and 0.1%.
For last year, 2019, the data show a continuation, with annual wages rising fastest for those in the top 10% while those in the bottom 90% saw below-average wage growth.
This unceasing growth of wage inequality that undercuts wage growth for the bottom 90% reaffirms the need to place generating robust wage growth for the vast majority and rebuilding worker power at the center of economic policymaking.
A similar pattern as in 2019 prevailed over the entire 2007-19 business cycle as wages were redistributed in two ways, up from the bottom 90% to the top 10% and within the top 10% from the top 1% to those in the remaining 9% of the top 10%. Still, the top 1% has done far better in the 2009-19 recovery (wages rose 20.4%) than did those in the bottom 90% (wages rose only 8.7%).
As Figure A shows, the top 1% and the very tippy top, those in the top 0.1%, were the clear winners over the longer-term 1979-2019 period:
This disparity in wage growth reflects a sharp long-term rise in the share of total wages earned by those in the top 1.0% and 0.1%.
These are the results of EPI's updated series on wages by earning group, which is developed from published Social Security Administration (SSA) data and updates the wage series from 1947-2004 originally published by Kopczuk, Saez and Song (2010). These data, unlike the usual source of our other wage analyses (the Current Population Survey) allow us to estimate wage trends for the top 1.0% and top 0.1% of earners, as well as those for the bottom 90% and other categories among the top 10% of earners. These wage data are not top-coded, meaning the underlying earnings reported are actual earnings and not "capped" or "top-coded" for confidentiality. These SSA wage data are W-2 earnings which includes realized stock options and vested stock awards.
Over the longer-term, since 1979, there was far faster wage growth at the top (highest 1.0%) and tippy-top (upper 0.1%) signaling a major redistribution upwards from the bottom 90%. As Figure A shows, the top 1.0% of earners are now paid 160.3% more than they were in 1979. Even more impressive is that those in the top 0.1% had more than double that wage growth, up 345.2% since 1979 (Table 1). In contrast, wages for the bottom 90% only grew 26.0% in that time. The other segments of the top 10% (those in the 90-95th percentiles and the 95-99th percentiles) also had faster-than-average wage growth since 1979, up 51.8% and 75.1%, but nowhere near as fast as the wage growth at the top. Thus, wages have been redistributed upward since 1979 from the bottom 90% to the top 10% and within the top 10% to the top 1% and especially to the top 0.1%.
This pattern of wage upward wage distribution also prevailed over the recent recovery (since 2009): the bottom 90% experienced modest annual wage growth--reflecting growing annual hours as well as higher hourly wages--up 8.7% from 2009 to 2019. In contrast, the wages of the top 1.0% and top 0.1% grew, respectively, 20.4% and 30.3% in the last ten years.
In the most recent year, however, wages grew fastest for the bottom 9% of the top 10% (up 4.2% for 90-95th percentiles, up 2.2% for 95-99th percentiles) and slower than average for the bottom 90% (up 1.7%) and the top 0.1% and top 1% (both up 1.0%).
One key characteristic of the Great Recession downturn was the big hit on the very highest earners, with the top 1% and top 0.1% seeing 15.6% and 26.1% declines over the two years from 2007 to 2009. Even by 2019 the top 0.1% had not recovered from this sharp fall at the start of the business cycle as the top 1.0% as a whole earned only 1.6% above their 2007 earnings. Thus, the business cycle from 2007 to 2019 was one where wages were redistributed from the bottom 90% to the top 10% and within the top 10% from the top 1% to the remainder of the top 10% (the 90th to 99th percentiles). The one constant wage dynamic in every period since 1979 has been that the wages for the bottom 90% are continuously redistributed upwards.
It is worth noting that our series on the wage growth of the bottom 90% corresponds closely to the Social Security Administration's series on median annual earnings: between 1991 and 2019 the real median annual wage grew 23.8%, very close to the 26.0% growth for the bottom 90%.
It is also noteworthy that the wage growth for the bottom 90% was almost entirely concentrated in the two periods of sustained low unemployment representing 11 of the 40 years: the bottom 90%'s wage growth in the 1995-2000 and 2013-19 periods represented 90% of all the wage growth ($7,230 of $8,043) over the entire 1979-2019 period. The shift of wages away from the bottom 90% meant that their wages rose 26.0% rather than the 44.6% increase obtained on average over the 1979-2019 period, some 18.6 percentage points faster growth.
These disparities in long-term wage growth reflect a major redistribution upwards of wages since 1979, as noted earlier. The bottom 90% earned 69.8% of all earnings in 1979 but only 60.9% in 2019 (Table 2). In contrast the top 1.0% nearly doubled its share of earnings from 7.3% in 1979 to 13.2% in 2019. The growth of wages for the top 0.1% is the major dynamic driving the top 1.0% earnings as the top 0.1% more than tripled its earnings share from 1.6% in 1979 to 5.0% in 2019.
The bottom 90% lost some ground over the recent business cycle, 2007-19, as their wage share fell slightly from 61.1% to 60.9%. The winners in the recent business cycle were not the top 1% whose wage share fell from 14.1% to13.2%. Rather, the upward redistribution of wages from the bottom 90% and the shift away from the top 1.0% in the recent business cycle accrued to the other high earners in the top 10%, those earning between the 90th and 95th percentiles (averaging $129,998 in 2019) and between the 95th and 99th percentiles (averaging $210,511 in 2019).