
Government policies enacted in the wake of the pandemic have proven critical for reducing child poverty in the United States. Census Bureau data released last week showed that government social programs kept tens of millions of people out of poverty in 2021.
Child poverty reached its lowest level on record, as calculated by the Supplemental Poverty Measure (a measure that includes both cash and noncash benefits). This new historic low is largely thanks to the expanded Child Tax Credit (CTC), a key component of the 2021 American Rescue Plan (ARP) that has since expired. Without additional action by Congress to renew the expanded Child Tax Credit, we should expect higher child poverty in future years.
Let's start with the outstanding role the Child Tax Credit played in reducing child poverty. The Child Tax Credit is a payment to support families raising children under 17 years of age of up to $2000 per qualifying child. The 2021 ARP expanded the credit to increase the level of earnings to families receiving the credit (up to $3600 per child under age 6) and to make the credit more widely available and fully refundable.
The refundable Child Tax Credits alone account for a reduction in child poverty of 2.9 million. Within that, the expanded Child Tax Credits--a key element of the 2021 American Rescue Plan (ARP)--lifted 2.1 million children out of poverty. The ARP Child Tax Credit is the leading reason child poverty fell so precipitously from 9.7% in 2020 to 5.2% in 2021, the lowest rate on record. Nearly three-quarters of the poverty reducing impact of the Child Tax Credits came from the ARP expansions. In total, the increasing importance of the Child Tax Credit is responsible for about 70% or 3.1 percentage points of that 4.5 percentage point reduction in poverty between 2020 and 2021.
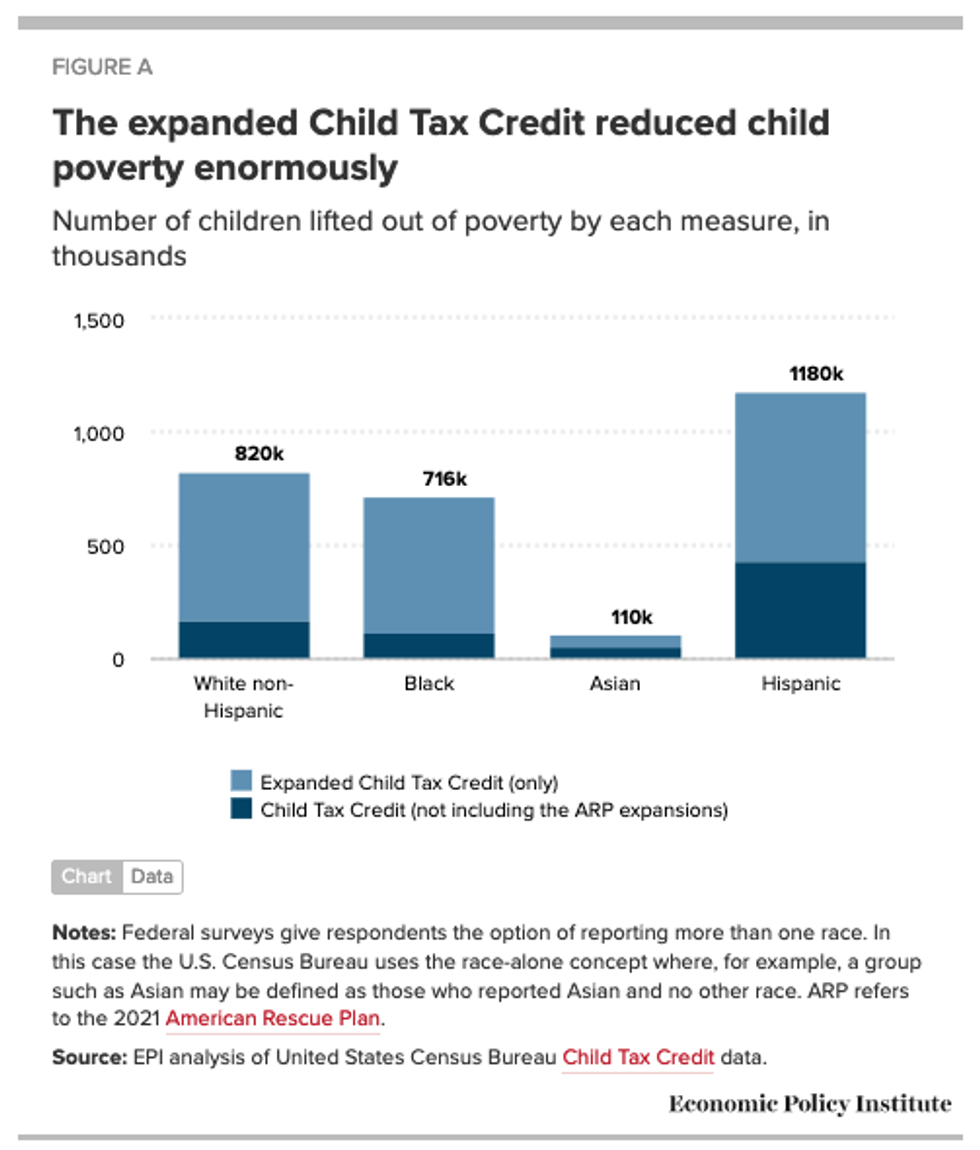
Figure A separates out the effects of the Child Tax Credit without the expansions and the expanded Child Tax Credit on children's poverty by race and ethnicity. White non-Hispanic child poverty was lower by 820,000 in 2021 because of the Child Tax Credits, 649,000 of which came from the expansions. 716,000 fewer Black children were in poverty in 2021 because of the Child Tax Credit--over 80% of that reduction in poverty came from the ARP expansions to the Child Tax Credit, one of the key reasons why Black child poverty fell by more than half between 2020 and 2021. Hispanic child poverty also saw dramatic reductions from the expansions.
Some debate has surfaced around whether the child poverty rate was the lowest on record, pertaining to the Supplemental Poverty Measure (SPM) and breaks in the series that not only impact the SPM, but also the official poverty measure, median household income, and other metrics related to the Current Population Social and Economic Supplement (CPS ASEC). The CPS ASEC--sometimes referred to as the March CPS--asks retrospective questions of households in the spring of one year about their economic circumstances in the prior year. Over the last decade, the Census has changed the survey questions and methodology to more accurately measure households' economic circumstances. The Census Bureau has always been quite clear about the "breaks" in the series and has provided some guidance on how to make more reliable comparisons across time.
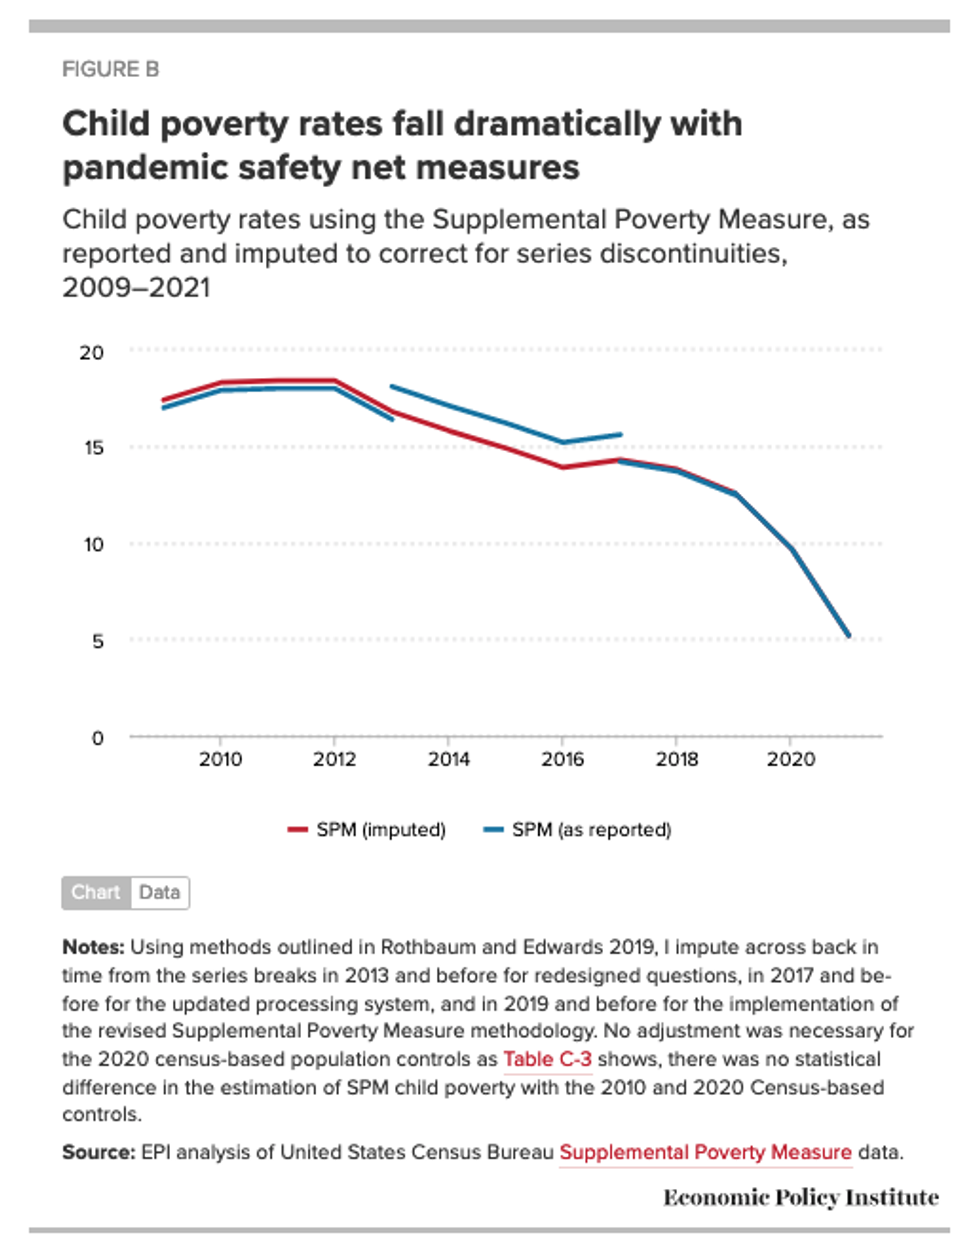
Even after accounting for the changes in methodology, it's pretty clear that the child poverty rate in 2021 still represents a record low. Figure B illustrates SPM child poverty rates as published in blue with the noted series breaks. In red, I've constructed an alternative series, in an attempt to "correct" for the series breaks. Census researchers estimated the effect various changes had on the SPM at each break point, and I increased or decreased the historical estimates accordingly to make the SPM child rates more comparable over time. The redesigned questionnaire led to the series break in 2013, while the new processing system led to a series break in 2017. A smaller break in 2019 reflects the implementation of revised methodology. While much ado was made of the need to account for the processing break, which would artificially suggest a drop in the series, other changes moved in the opposite direction. Evidently, the series breaks appear to have little-to-no effect on the conclusion that child poverty is at a historic low. The story is about the drop in poverty over the last two years because of expanded government programs.
There may still be lingering concerns about potential sampling bias before and during the pandemic or the changes to the population controls based on the 2020 decennial census. I'm not terribly concerned that those change the overall story. Below, I explain why.
Sampling bias is certainly a concern, not only during the pandemic when households may have been harder to reach, but even before. Census Bureau researchers have written extensively on the sampling issues before and since the pandemic. The trends in monthly response rates, as shown in Figure 1 here, are troubling; not only did response rates decline, but they differed dramatically between respondents by earnings and income. This has the potential to produce misleading estimates on the state of economic well-being overall and for specific population groups.
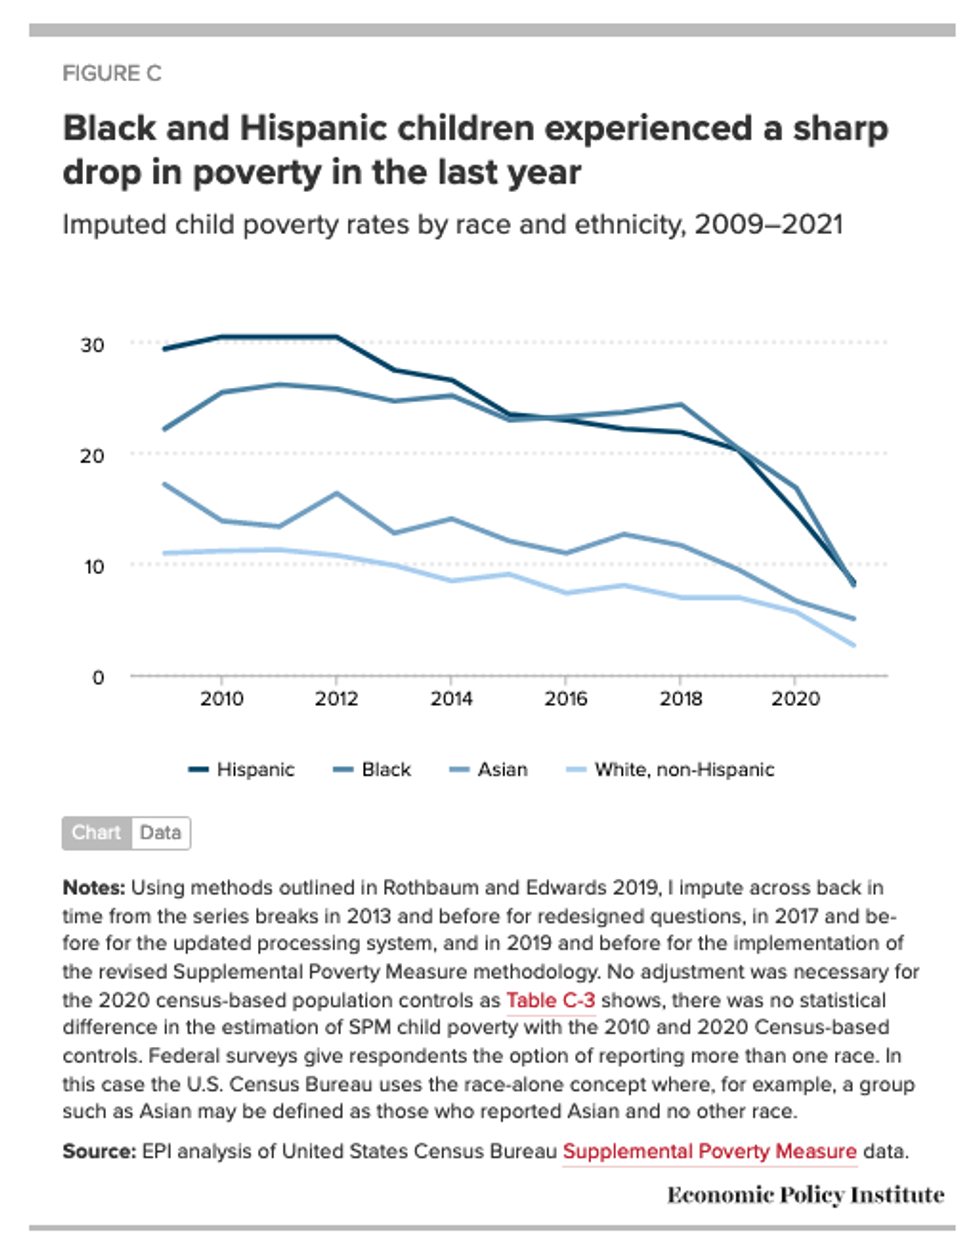
Before the pandemic, sampling bias did not lead to statistically significant differences in SPM poverty rates, overall or by race and ethnicity. The drop-off in response rates during the pandemic, particularly when the data were collected for the 2019 data year, did have an impact on poverty rates. Rothbaum and Bee (2022) find the following: "From 2020 to 2022, official poverty rates with the alternative weights were slightly--yet statistically significantly--higher than the survey estimates, by a half percentage point, four-tenths of a point, and three-tenths of a point, respectively." While they do not provide data on the child SPM rates, or even SPM rates in general, if we were to extrapolate that measurement bias to the SPM imputations in Figures B and C, the results hold. That is, child poverty would still be the lowest on record. It's also worth noting that the Census-based population controls had no statistically significant impact on SPM child poverty.
All in all, child poverty was the lowest on record in 2021, largely due to key expansions of the Child Tax Credit. Unfortunately, that's where the good news ends--policymakers let those vital tax credits expire at the end of 2021, leading to higher child poverty rates in 2022.
Government policies enacted in the wake of the pandemic have proven critical for reducing child poverty in the United States. Census Bureau data released last week showed that government social programs kept tens of millions of people out of poverty in 2021.
Child poverty reached its lowest level on record, as calculated by the Supplemental Poverty Measure (a measure that includes both cash and noncash benefits). This new historic low is largely thanks to the expanded Child Tax Credit (CTC), a key component of the 2021 American Rescue Plan (ARP) that has since expired. Without additional action by Congress to renew the expanded Child Tax Credit, we should expect higher child poverty in future years.
Let's start with the outstanding role the Child Tax Credit played in reducing child poverty. The Child Tax Credit is a payment to support families raising children under 17 years of age of up to $2000 per qualifying child. The 2021 ARP expanded the credit to increase the level of earnings to families receiving the credit (up to $3600 per child under age 6) and to make the credit more widely available and fully refundable.
The refundable Child Tax Credits alone account for a reduction in child poverty of 2.9 million. Within that, the expanded Child Tax Credits--a key element of the 2021 American Rescue Plan (ARP)--lifted 2.1 million children out of poverty. The ARP Child Tax Credit is the leading reason child poverty fell so precipitously from 9.7% in 2020 to 5.2% in 2021, the lowest rate on record. Nearly three-quarters of the poverty reducing impact of the Child Tax Credits came from the ARP expansions. In total, the increasing importance of the Child Tax Credit is responsible for about 70% or 3.1 percentage points of that 4.5 percentage point reduction in poverty between 2020 and 2021.
Figure A separates out the effects of the Child Tax Credit without the expansions and the expanded Child Tax Credit on children's poverty by race and ethnicity. White non-Hispanic child poverty was lower by 820,000 in 2021 because of the Child Tax Credits, 649,000 of which came from the expansions. 716,000 fewer Black children were in poverty in 2021 because of the Child Tax Credit--over 80% of that reduction in poverty came from the ARP expansions to the Child Tax Credit, one of the key reasons why Black child poverty fell by more than half between 2020 and 2021. Hispanic child poverty also saw dramatic reductions from the expansions.
Some debate has surfaced around whether the child poverty rate was the lowest on record, pertaining to the Supplemental Poverty Measure (SPM) and breaks in the series that not only impact the SPM, but also the official poverty measure, median household income, and other metrics related to the Current Population Social and Economic Supplement (CPS ASEC). The CPS ASEC--sometimes referred to as the March CPS--asks retrospective questions of households in the spring of one year about their economic circumstances in the prior year. Over the last decade, the Census has changed the survey questions and methodology to more accurately measure households' economic circumstances. The Census Bureau has always been quite clear about the "breaks" in the series and has provided some guidance on how to make more reliable comparisons across time.
Even after accounting for the changes in methodology, it's pretty clear that the child poverty rate in 2021 still represents a record low. Figure B illustrates SPM child poverty rates as published in blue with the noted series breaks. In red, I've constructed an alternative series, in an attempt to "correct" for the series breaks. Census researchers estimated the effect various changes had on the SPM at each break point, and I increased or decreased the historical estimates accordingly to make the SPM child rates more comparable over time. The redesigned questionnaire led to the series break in 2013, while the new processing system led to a series break in 2017. A smaller break in 2019 reflects the implementation of revised methodology. While much ado was made of the need to account for the processing break, which would artificially suggest a drop in the series, other changes moved in the opposite direction. Evidently, the series breaks appear to have little-to-no effect on the conclusion that child poverty is at a historic low. The story is about the drop in poverty over the last two years because of expanded government programs.
There may still be lingering concerns about potential sampling bias before and during the pandemic or the changes to the population controls based on the 2020 decennial census. I'm not terribly concerned that those change the overall story. Below, I explain why.
Sampling bias is certainly a concern, not only during the pandemic when households may have been harder to reach, but even before. Census Bureau researchers have written extensively on the sampling issues before and since the pandemic. The trends in monthly response rates, as shown in Figure 1 here, are troubling; not only did response rates decline, but they differed dramatically between respondents by earnings and income. This has the potential to produce misleading estimates on the state of economic well-being overall and for specific population groups.
Before the pandemic, sampling bias did not lead to statistically significant differences in SPM poverty rates, overall or by race and ethnicity. The drop-off in response rates during the pandemic, particularly when the data were collected for the 2019 data year, did have an impact on poverty rates. Rothbaum and Bee (2022) find the following: "From 2020 to 2022, official poverty rates with the alternative weights were slightly--yet statistically significantly--higher than the survey estimates, by a half percentage point, four-tenths of a point, and three-tenths of a point, respectively." While they do not provide data on the child SPM rates, or even SPM rates in general, if we were to extrapolate that measurement bias to the SPM imputations in Figures B and C, the results hold. That is, child poverty would still be the lowest on record. It's also worth noting that the Census-based population controls had no statistically significant impact on SPM child poverty.
All in all, child poverty was the lowest on record in 2021, largely due to key expansions of the Child Tax Credit. Unfortunately, that's where the good news ends--policymakers let those vital tax credits expire at the end of 2021, leading to higher child poverty rates in 2022.
- House Progressives Revive Legislation to 'Cut Child Poverty by Nearly Two-Thirds' ›
- Opinion | The End of Covid-Era Benefits Reveals a Society Still Profoundly Sick | Common Dreams ›
- Opinion | Pandemic Social Programs Saved My Life. Now the GOP Want to Shred What Little Is Left | Common Dreams ›
- House Dems Revive Bill to Make Poverty-Eradicating Child Tax Credit Permanent ›
- Opinion | A Quarterly Report on the Economy for Working People | Common Dreams ›
- Opinion | Bring Back the Child Tax Credit Expansion | Common Dreams ›
- Opinion | Census Data Show Poverty Is a Policy Choice | Common Dreams ›
- Opinion | We Know What Works to Fight Poverty—Now Let’s Do It | Common Dreams ›
- To Fight Poverty, Economists Urge Congress to Bring Back Expanded Child Tax Credit ›
- Opinion | Will Congressional Progressive Caucus Ever Draw a Red Line? | Common Dreams ›
- 'Unacceptable': US Homelessness Hits Record High ›
- 'Not a Good Deal for Working Families': Sanders Votes No on Tax Bill | Common Dreams ›
- Opinion | Both Parties Should Rally Behind Expanding the Child Tax Credit | Common Dreams ›