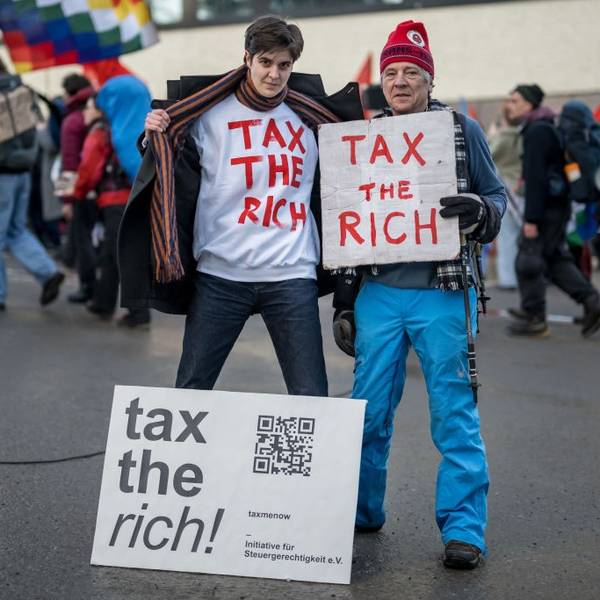
Some may call this level of inequality extreme. Obscene would be more appropriate. (Photo: Len Tsou/Flickr/cc)
Inequality in America: Far Beyond Extreme
The maldistribution of America’s income and wealth has reached levels that our conventional economic stats have trouble revealing.
We've all seen the stats on America's extreme inequality. Over 20 percent of our nation's income flows to the top 1 percent. The top 1 percent's share of our country's wealth is approaching 40 percent. Our top 0.1 percent hold roughly the same share of our wealth as our bottom 90 percent.
All eye-popping numbers to be sure. But don't be fooled. These numbers understate our problem. And not by just a little.
Let's consider, for a moment, what our income and wealth numbers are really telling us. Statistics on how we share our wealth right now tell us where things stand, but not how we ended up where we stand--k[or where we're heading. Stats on how we share our income don't tell us anything about how we're sharing in wealth's accumulation.
Take, for instance, the value of the Jeff Bezos Amazon fortune. If this value doubles, the increase doesn't register anywhere as "income" for Bezos until he sells his Amazon stock. And the resulting income numbers don't reflect what living expenses and taxes consume.
So our conventional measures of income and wealth don't tell the whole story. We need to know more about how our society is sharing the real wealth we create, more about what remains from the fruits of our collective efforts after we take into account all the costs involved and after adjusting for inflation and population growth.
Through that lens, we see a rather gruesome picture.
Of America's inflation- and population-adjusted increase in wealth between 2006 and 2018, over 87 percent went to the top 10 percent. Over 60 percent went to the top 1 percent. The top .01 percent, a baseball-park-sized group of just 32,669 Americans, grabbed over 23 percent of the country's increase in wealth.
And nearly 10 percent of that increase went to the 400 wealthiest Americans.
The 290 million or so unlucky souls who make up the so-called bottom 90 percent, meanwhile, saw just 13 percent of the nation's wealth gains between 2006 and 2018, not much over half of what went to the top .01 percent. Our bottom 50 percent actually lost wealth over that 2006-2018 period.
Some may call this level of inequality extreme. Obscene would be more appropriate.
I calculated these wealth-gain shares from data compiled by Emmanuel Saez and Gabriel Zucman, two leading economists now at the University of California-Berkeley. Other data sets -- the Federal Reserve's triennial Survey of Consumer Finances, for one -- let us calculate much the same basic story.
In 2018, according to the Saez and Zucman figures, U.S. household wealth stood at $88.662 trillion, up from $68.310 trillion in 2006, with both figures in 2018 dollars.
Between 2006 and 2018, our U.S. population increased by 9.5 percent, to 326.69 million. To create a true, apples-to-apples comparison, I increased the Saez-Zucman 2006 household wealth figure to $74.791 trillion. That total amounts to the household wealth a country of 326.69 million people would need to have to be equivalent, on a per-person basis, to the nation of 298.38 million people we had in 2006. That 2006 nation held $68.310 million in household wealth.
The inflation- and population-adjusted increase in America's wealth between 2006 and 2018 turns out to bring us from $74.791 trillion to $88.662 trillion, a difference of $13.871 trillion.
My next step: applying the Saez and Zucman wealth-share percentages to this inflation- and population-adjusted increase in America's wealth.
The end-result of all this number crunching: Of that $13.871-trillion increase in inflation- and population-adjusted household wealth, $12.078 trillion went to the nation's wealthiest 10 percent, leaving just $1.793 trillion to the bottom 90 percent.
Within that $12.078 trillion for the top 10 percent, $8.537 trillion went to the top 1 percent, $5.519 trillion to the top 0.1 percent, and $3.201 trillion to the top 0.01 percent. And the 400 wealthiest Americans? They pulled down $1.314 trillion of the increase.
Unfortunately, this obscene inequality appears likely to get worse. As the 2006-to-2018 period ended -- and after our top 1 percent had already grabbed an appallingly outsized portion of the wealth created during those dozen years -- the Trump tax act enacted at the end of 2017 went into effect, a giant giveaway to the top 1 percent.
This is insanity.
Now.
An Urgent Message From Our Co-Founder
Dear Common Dreams reader, It’s been nearly 30 years since I co-founded Common Dreams with my late wife, Lina Newhouser. We had the radical notion that journalism should serve the public good, not corporate profits. It was clear to us from the outset what it would take to build such a project. No paid advertisements. No corporate sponsors. No millionaire publisher telling us what to think or do. Many people said we wouldn't last a year, but we proved those doubters wrong. Together with a tremendous team of journalists and dedicated staff, we built an independent media outlet free from the constraints of profits and corporate control. Our mission has always been simple: To inform. To inspire. To ignite change for the common good. Building Common Dreams was not easy. Our survival was never guaranteed. When you take on the most powerful forces—Wall Street greed, fossil fuel industry destruction, Big Tech lobbyists, and uber-rich oligarchs who have spent billions upon billions rigging the economy and democracy in their favor—the only bulwark you have is supporters who believe in your work. But here’s the urgent message from me today. It's never been this bad out there. And it's never been this hard to keep us going. At the very moment Common Dreams is most needed, the threats we face are intensifying. We need your support now more than ever. We don't accept corporate advertising and never will. We don't have a paywall because we don't think people should be blocked from critical news based on their ability to pay. Everything we do is funded by the donations of readers like you. When everyone does the little they can afford, we are strong. But if that support retreats or dries up, so do we. Will you donate now to make sure Common Dreams not only survives but thrives? —Craig Brown, Co-founder |
We've all seen the stats on America's extreme inequality. Over 20 percent of our nation's income flows to the top 1 percent. The top 1 percent's share of our country's wealth is approaching 40 percent. Our top 0.1 percent hold roughly the same share of our wealth as our bottom 90 percent.
All eye-popping numbers to be sure. But don't be fooled. These numbers understate our problem. And not by just a little.
Let's consider, for a moment, what our income and wealth numbers are really telling us. Statistics on how we share our wealth right now tell us where things stand, but not how we ended up where we stand--k[or where we're heading. Stats on how we share our income don't tell us anything about how we're sharing in wealth's accumulation.
Take, for instance, the value of the Jeff Bezos Amazon fortune. If this value doubles, the increase doesn't register anywhere as "income" for Bezos until he sells his Amazon stock. And the resulting income numbers don't reflect what living expenses and taxes consume.
So our conventional measures of income and wealth don't tell the whole story. We need to know more about how our society is sharing the real wealth we create, more about what remains from the fruits of our collective efforts after we take into account all the costs involved and after adjusting for inflation and population growth.
Through that lens, we see a rather gruesome picture.
Of America's inflation- and population-adjusted increase in wealth between 2006 and 2018, over 87 percent went to the top 10 percent. Over 60 percent went to the top 1 percent. The top .01 percent, a baseball-park-sized group of just 32,669 Americans, grabbed over 23 percent of the country's increase in wealth.
And nearly 10 percent of that increase went to the 400 wealthiest Americans.
The 290 million or so unlucky souls who make up the so-called bottom 90 percent, meanwhile, saw just 13 percent of the nation's wealth gains between 2006 and 2018, not much over half of what went to the top .01 percent. Our bottom 50 percent actually lost wealth over that 2006-2018 period.
Some may call this level of inequality extreme. Obscene would be more appropriate.
I calculated these wealth-gain shares from data compiled by Emmanuel Saez and Gabriel Zucman, two leading economists now at the University of California-Berkeley. Other data sets -- the Federal Reserve's triennial Survey of Consumer Finances, for one -- let us calculate much the same basic story.
In 2018, according to the Saez and Zucman figures, U.S. household wealth stood at $88.662 trillion, up from $68.310 trillion in 2006, with both figures in 2018 dollars.
Between 2006 and 2018, our U.S. population increased by 9.5 percent, to 326.69 million. To create a true, apples-to-apples comparison, I increased the Saez-Zucman 2006 household wealth figure to $74.791 trillion. That total amounts to the household wealth a country of 326.69 million people would need to have to be equivalent, on a per-person basis, to the nation of 298.38 million people we had in 2006. That 2006 nation held $68.310 million in household wealth.
The inflation- and population-adjusted increase in America's wealth between 2006 and 2018 turns out to bring us from $74.791 trillion to $88.662 trillion, a difference of $13.871 trillion.
My next step: applying the Saez and Zucman wealth-share percentages to this inflation- and population-adjusted increase in America's wealth.
The end-result of all this number crunching: Of that $13.871-trillion increase in inflation- and population-adjusted household wealth, $12.078 trillion went to the nation's wealthiest 10 percent, leaving just $1.793 trillion to the bottom 90 percent.
Within that $12.078 trillion for the top 10 percent, $8.537 trillion went to the top 1 percent, $5.519 trillion to the top 0.1 percent, and $3.201 trillion to the top 0.01 percent. And the 400 wealthiest Americans? They pulled down $1.314 trillion of the increase.
Unfortunately, this obscene inequality appears likely to get worse. As the 2006-to-2018 period ended -- and after our top 1 percent had already grabbed an appallingly outsized portion of the wealth created during those dozen years -- the Trump tax act enacted at the end of 2017 went into effect, a giant giveaway to the top 1 percent.
This is insanity.
Now.