
SUBSCRIBE TO OUR FREE NEWSLETTER
Daily news & progressive opinion—funded by the people, not the corporations—delivered straight to your inbox.
5
#000000
#FFFFFF
To donate by check, phone, or other method, see our More Ways to Give page.
Daily news & progressive opinion—funded by the people, not the corporations—delivered straight to your inbox.

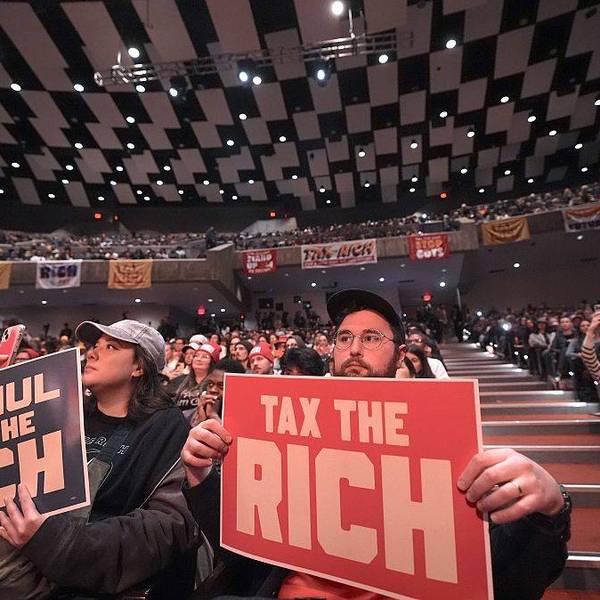
CEO and founder of Amazon Jeff Bezos participates in a discussion during a Milestone Celebration dinner September 13, 2018 in Washington, D.C. (Photo: Alex Wong/Getty Images)
Newly available wage data for 2018 show that annual wages for the top 1.0% were nearly flat (up 0.2%) while wages for the bottom 90% rose an above-average 1.4%. Still, the top 1.0% has done far better in the 2009-18 recovery (their wages rose 19.2%) than did those in the bottom 90%, whose wages rose only 6.8%. Over the last four decades since 1979, the top 1.0% saw their wages grow by 157.8% and those in the top 0.1% had wages grow more than twice as fast, up 340.7%. In contrast those in the bottom 90% had annual wages grow by 23.9% from 1979 to 2018. This disparity in wage growth reflects a sharp long-term rise in the share of total wages earned by those in the top 1.0% and 0.1%.
These are the results of EPI's updated series on wages by earning group, which is developed from published Social Security Administration data and updates the wage series from 1947-2004 originally published by Kopczuk, Saez and Song (2010). These data, unlike the usual source of our other wage analyses (the Current Population Survey) allow us to estimate wage trends for the top 1.0% and top 0.1% of earners, as well as those for the bottom 90% and other categories among the top 10% of earners. These data are not top-coded, meaning the underlying earnings reported are actual earnings and not "capped" or "top-coded" for confidentiality.
As Figure A shows, the top 1.0% of earners are now paid 157.8% more than they were in 1979. Even more impressive is that those in the top 0.1% had more than double that wage growth, up 340.7% since 1979 (Table 1). In contrast, wages for the bottom 90% only grew 23.9% in that time. Since the Great Recession, the bottom 90%, in contrast, experienced very modest wage growth, with annual wages--reflecting growing annual hours as well as higher hourly wages--up just 6.8% from 2009 to 2018. In contrast, the wages of the top 0.1% grew 19.2% during those nine years.
Wages fell furthest among the top 0.1% and 1.0% of earners during the financial crisis from 2007 to 2009 and the top 0.1% in 2018 had not yet recovered their prior earnings in 2007.
It is worth noting that our series on the wage growth of the bottom 90% corresponds closely to the Social Security Administration's series on median annual earnings: between 1990 and 2018 the real median annual wage grew 21.2%, very close to the 22.5% growth for the bottom 90%.
These disparities in wage growth reflect a major change in the distribution of wages since 1979. The bottom 90% earned 69.8% of all earnings in 1979 but only 61.0% in 2018. In contrast the top 1.0% increased its share of earnings from 7.3% in 1979 to 13.3% in 2018, a near-doubling. The growth of wages for the top 0.1% is the major dynamic driving the top 1.0% earnings as the top 0.1% more than tripled its earnings share from 1.6% in 1979 to 5.1% in 2018.
Dear Common Dreams reader, It’s been nearly 30 years since I co-founded Common Dreams with my late wife, Lina Newhouser. We had the radical notion that journalism should serve the public good, not corporate profits. It was clear to us from the outset what it would take to build such a project. No paid advertisements. No corporate sponsors. No millionaire publisher telling us what to think or do. Many people said we wouldn't last a year, but we proved those doubters wrong. Together with a tremendous team of journalists and dedicated staff, we built an independent media outlet free from the constraints of profits and corporate control. Our mission has always been simple: To inform. To inspire. To ignite change for the common good. Building Common Dreams was not easy. Our survival was never guaranteed. When you take on the most powerful forces—Wall Street greed, fossil fuel industry destruction, Big Tech lobbyists, and uber-rich oligarchs who have spent billions upon billions rigging the economy and democracy in their favor—the only bulwark you have is supporters who believe in your work. But here’s the urgent message from me today. It's never been this bad out there. And it's never been this hard to keep us going. At the very moment Common Dreams is most needed, the threats we face are intensifying. We need your support now more than ever. We don't accept corporate advertising and never will. We don't have a paywall because we don't think people should be blocked from critical news based on their ability to pay. Everything we do is funded by the donations of readers like you. When everyone does the little they can afford, we are strong. But if that support retreats or dries up, so do we. Will you donate now to make sure Common Dreams not only survives but thrives? —Craig Brown, Co-founder |
Newly available wage data for 2018 show that annual wages for the top 1.0% were nearly flat (up 0.2%) while wages for the bottom 90% rose an above-average 1.4%. Still, the top 1.0% has done far better in the 2009-18 recovery (their wages rose 19.2%) than did those in the bottom 90%, whose wages rose only 6.8%. Over the last four decades since 1979, the top 1.0% saw their wages grow by 157.8% and those in the top 0.1% had wages grow more than twice as fast, up 340.7%. In contrast those in the bottom 90% had annual wages grow by 23.9% from 1979 to 2018. This disparity in wage growth reflects a sharp long-term rise in the share of total wages earned by those in the top 1.0% and 0.1%.
These are the results of EPI's updated series on wages by earning group, which is developed from published Social Security Administration data and updates the wage series from 1947-2004 originally published by Kopczuk, Saez and Song (2010). These data, unlike the usual source of our other wage analyses (the Current Population Survey) allow us to estimate wage trends for the top 1.0% and top 0.1% of earners, as well as those for the bottom 90% and other categories among the top 10% of earners. These data are not top-coded, meaning the underlying earnings reported are actual earnings and not "capped" or "top-coded" for confidentiality.
As Figure A shows, the top 1.0% of earners are now paid 157.8% more than they were in 1979. Even more impressive is that those in the top 0.1% had more than double that wage growth, up 340.7% since 1979 (Table 1). In contrast, wages for the bottom 90% only grew 23.9% in that time. Since the Great Recession, the bottom 90%, in contrast, experienced very modest wage growth, with annual wages--reflecting growing annual hours as well as higher hourly wages--up just 6.8% from 2009 to 2018. In contrast, the wages of the top 0.1% grew 19.2% during those nine years.
Wages fell furthest among the top 0.1% and 1.0% of earners during the financial crisis from 2007 to 2009 and the top 0.1% in 2018 had not yet recovered their prior earnings in 2007.
It is worth noting that our series on the wage growth of the bottom 90% corresponds closely to the Social Security Administration's series on median annual earnings: between 1990 and 2018 the real median annual wage grew 21.2%, very close to the 22.5% growth for the bottom 90%.
These disparities in wage growth reflect a major change in the distribution of wages since 1979. The bottom 90% earned 69.8% of all earnings in 1979 but only 61.0% in 2018. In contrast the top 1.0% increased its share of earnings from 7.3% in 1979 to 13.3% in 2018, a near-doubling. The growth of wages for the top 0.1% is the major dynamic driving the top 1.0% earnings as the top 0.1% more than tripled its earnings share from 1.6% in 1979 to 5.1% in 2018.