

SUBSCRIBE TO OUR FREE NEWSLETTER
Daily news & progressive opinion—funded by the people, not the corporations—delivered straight to your inbox.
5
#000000
#FFFFFF
To donate by check, phone, or other method, see our More Ways to Give page.
In a report released this week, I found that 2014 continued a 35-year trend of broad-based wage stagnation. Real, inflation-adjusted hourly wages stagnated or fell across the board, with one notable, glimmer of positive news: Unlike the rest of the wage distribution, wages actually increased at the 10th percentile between 2013 and 2014.
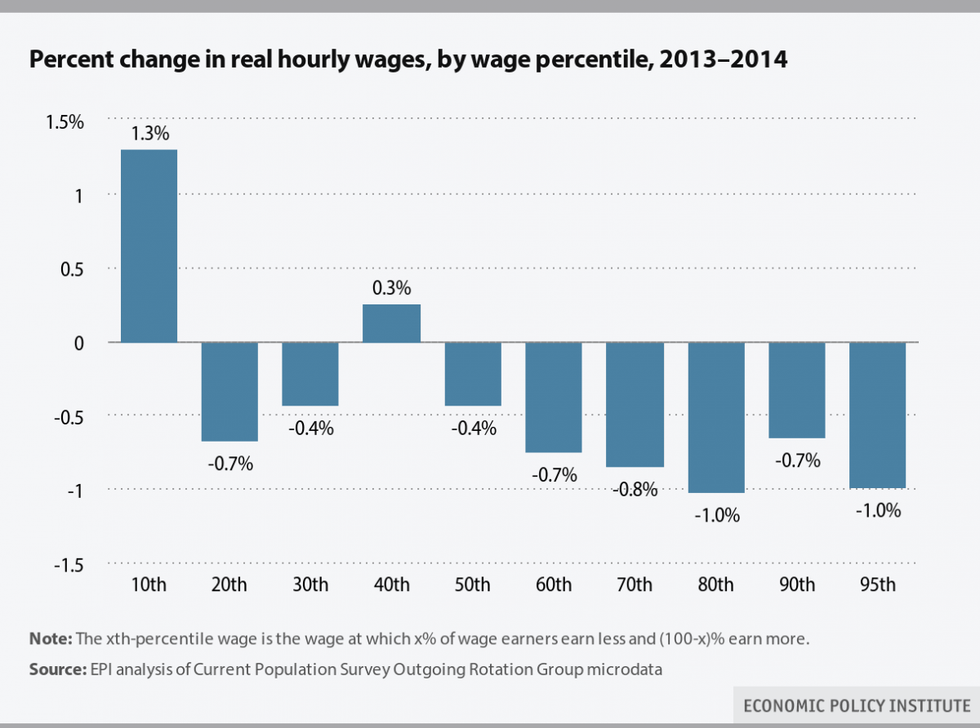
The figure below shows changes in real hourly wages throughout the wage distribution between 2013 and 2014. What is particularly striking is that almost every decile and the 95th percentile experienced real wage declines from 2013 to 2014, with two exceptions. First, there was a very small increase at the 40th percentile wage, up 3 cents, or 0.3 percent. But a more economically significant increase occurred at the 10th percentile where hourly wages were up 11 cents, or 1.3 percent.
So, why did wages at the bottom tick up when they fell for nearly everyone else? What is so special about that wage that sits below 90 percent and above 10 percent of workers (i.e., is not generally earned by particularly privileged workers)?
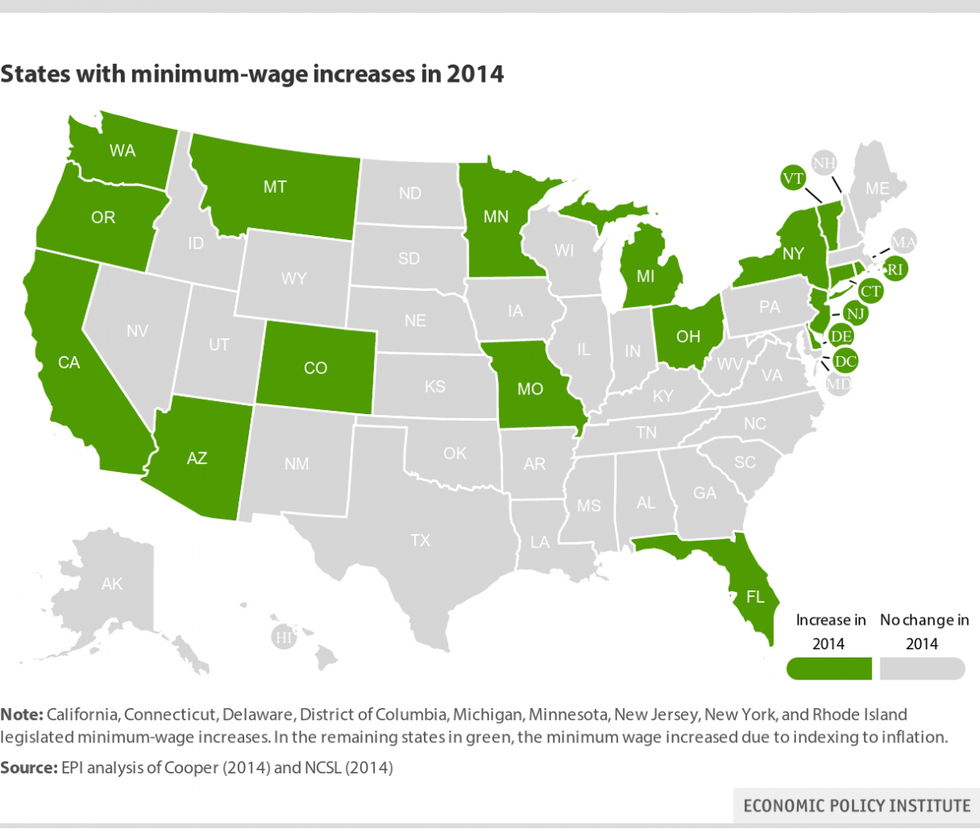
The answer is simple: we still have some labor standards that provide wage protections. More specifically, 18 states increased their minimum wage in 2014 (either through legislation or through automatic inflation adjustments). The states with minimum wage increases in 2014, displayed in green below, represent 57 percent of the workforce.
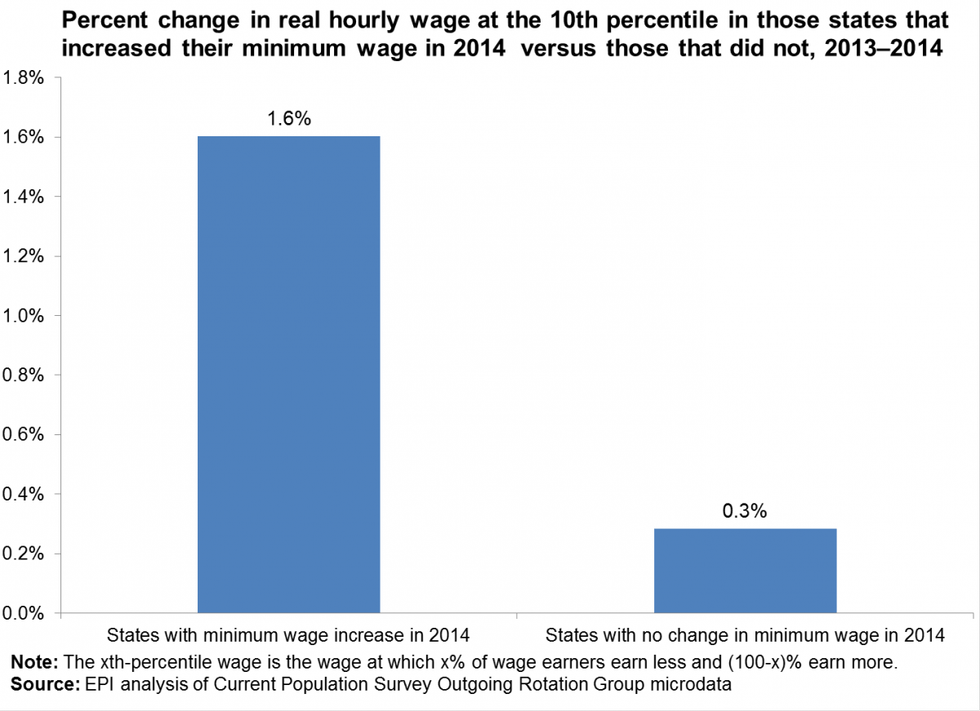
When we compare states with and without a minimum wage increase, we find clear evidence that the minimum wage is the reason people at the 10th percentile wage didn't see the negative trends found elsewhere in the workforce. The figure below compares the wages in these states with those in states without minimum wage increases. Wages at the 10th percentile rose by 1.6% in states with minimum wage increases, while in states without such an increase, they pretty much stagnated--increasing by a scant 0.3%.
The great news in this story is that policy can actually affect the labor market. And, it is imperative that we use all the policy levers at our disposal to help rejuvenate the economy, create jobs, and build stronger wage and income growth for the 99%.
In a report released this week, I found that 2014 continued a 35-year trend of broad-based wage stagnation. Real, inflation-adjusted hourly wages stagnated or fell across the board, with one notable, glimmer of positive news: Unlike the rest of the wage distribution, wages actually increased at the 10th percentile between 2013 and 2014.
The figure below shows changes in real hourly wages throughout the wage distribution between 2013 and 2014. What is particularly striking is that almost every decile and the 95th percentile experienced real wage declines from 2013 to 2014, with two exceptions. First, there was a very small increase at the 40th percentile wage, up 3 cents, or 0.3 percent. But a more economically significant increase occurred at the 10th percentile where hourly wages were up 11 cents, or 1.3 percent.
So, why did wages at the bottom tick up when they fell for nearly everyone else? What is so special about that wage that sits below 90 percent and above 10 percent of workers (i.e., is not generally earned by particularly privileged workers)?
The answer is simple: we still have some labor standards that provide wage protections. More specifically, 18 states increased their minimum wage in 2014 (either through legislation or through automatic inflation adjustments). The states with minimum wage increases in 2014, displayed in green below, represent 57 percent of the workforce.
When we compare states with and without a minimum wage increase, we find clear evidence that the minimum wage is the reason people at the 10th percentile wage didn't see the negative trends found elsewhere in the workforce. The figure below compares the wages in these states with those in states without minimum wage increases. Wages at the 10th percentile rose by 1.6% in states with minimum wage increases, while in states without such an increase, they pretty much stagnated--increasing by a scant 0.3%.
The great news in this story is that policy can actually affect the labor market. And, it is imperative that we use all the policy levers at our disposal to help rejuvenate the economy, create jobs, and build stronger wage and income growth for the 99%.