SUBSCRIBE TO OUR FREE NEWSLETTER
Daily news & progressive opinion—funded by the people, not the corporations—delivered straight to your inbox.
5
#000000
#FFFFFF
To donate by check, phone, or other method, see our More Ways to Give page.
Daily news & progressive opinion—funded by the people, not the corporations—delivered straight to your inbox.
While private sector gains are welcome news for millions of working families, access to paid sick leave remains vastly unequal.
Absent federal action, states and localities have expanded workers’ ability to earn paid sick leave to care for themselves and their families. The results of these efforts over the past dozen years are clear: There have been significant gains in access to paid sick time among private-sector workers. The latest data released Thursday morning from the Bureau of Labor Statistics show that these trends continued into 2024: 79% of private-sector workers have the ability to earn paid sick leave, an increase from 63% in 2012.
While these gains are welcome news for millions of working families, access to paid sick leave remains vastly unequal. As shown in the graph below, higher-wage workers have greater access to paid sick days than lower-wage workers. Among the 25% of private-sector workers with the highest wages, 94% have access to paid sick days. By contrast, among the 25% of workers with the lowest wages, only 58% have access to paid sick days. Prior releases have shown that the bottom 10% fare even worse, with only 39% having access to paid sick days in 2023 (though their access has improved, likely from state action).
This unequal access to paid sick days is particularly troubling since low-wage workers are least able to absorb lost wages when they or their family members are sick. Workers may have trouble paying for housing, food, health care, and other necessities (see Table 1 of this report).
While federal inaction on paid sick days continues to erode families’ economic security and needlessly spread illness, cities and states are stepping up for working people and serving as models for jurisdictions throughout the country. Minnesota is the latest example of states granting workers the ability to earn paid sick time in 2024. Measures to provide paid sick time are also on the ballots this November in Nebraska, Missouri, and Alaska.
Given variation in state laws, it’s no surprise that there are significant differences in access to paid sick time across the country, as shown below.
The share with access to paid sick days ranges from only 64% in the East South Central states (Alabama, Mississippi, Kentucky, and Tennessee) and 65% in the West South Central (Arkansas, Louisiana, Oklahoma, and Texas) up to 95% in the Pacific states (California, Oregon, Washington, Hawaii, and Alaska). Notably, many state governments in the East South Central and West South Central Census divisions have passed preemption laws prohibiting local municipalities from passing paid leave and sick day policies.
There is also huge variation in access to paid sick days across the private sector. Full-time workers are much more likely to have paid sick days than part-time workers (87% versus 55%). Unionized workers have greater access to paid sick days than nonunion workers (84% versus 79%).
Fortunately, there is a relatively simple way to address some of these inequities: The federal government can pass legislation to mandate paid sick leave for all workers. Paid sick leave not only helps reduce transmission of disease, it also provides economic security for workers who might otherwise lose income if they have to take time off from work.
"Exorbitant CEO pay has contributed to rising inequality in recent decades—concentrating earnings at the top and leaving fewer gains for ordinary workers," said one expert at the Economic Policy Institute.
Chief executive officers at the largest companies in the United States saw their compensation surge by 1,085% from 1978 to 2023, compared with only a 24% increase for typical worker pay, according to an annual report published Thursday.
The Economic Policy Insitute (EPI) analysis focuses on the 350 largest publicly owned U.S. firms by revenue.
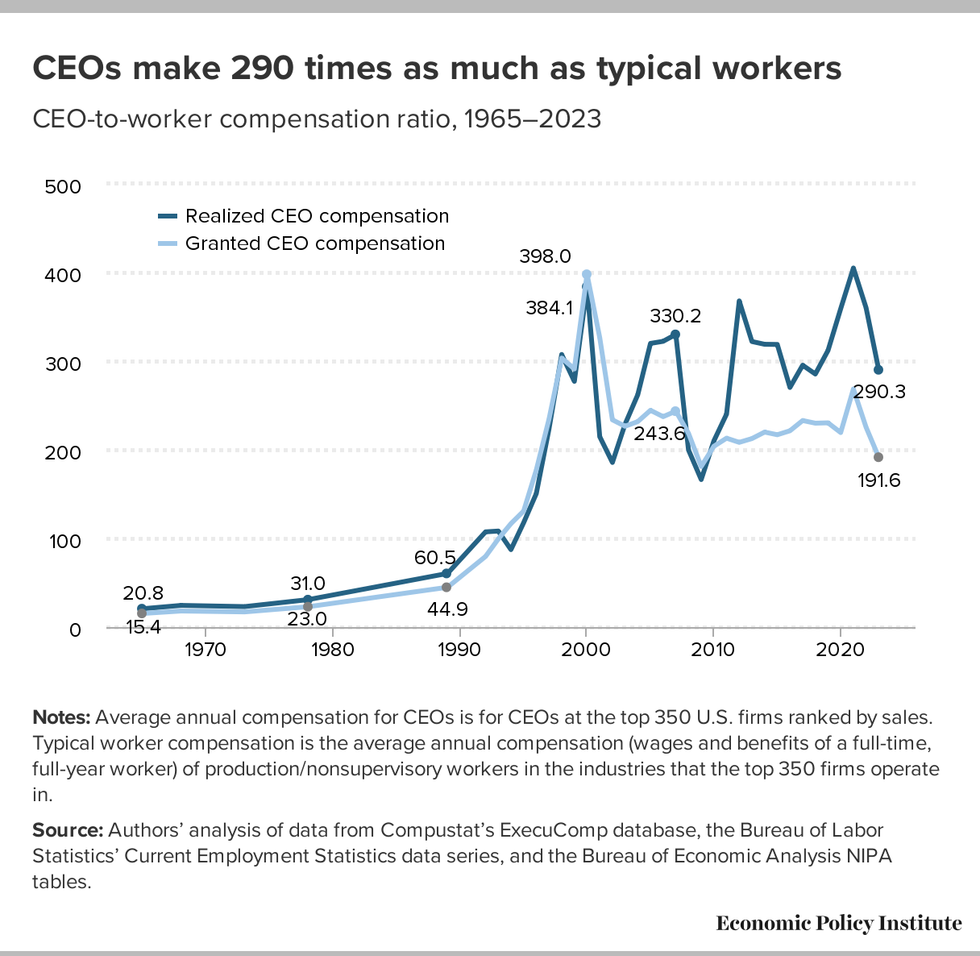
"Since CEO pay is mostly stock-based—and the value of stocks changes frequently—calculating it is not entirely straightforward," the report explains, so EPI uses "a backward-looking measure—realized compensation—and a forward-looking measure—granted compensation."
CEOs' annual realized compensation in 1978 was $1,874,000 in 1978, but rose to $22,207,000 last year—the 1,085% increase. Meanwhile, private-sector workers were making $57,000 a year nearly half a century ago, and have only seen that rise to $71,000. The figures were adjusted for inflation.
"The realized CEO-to-worker compensation ratio was 290-to-1 in 2023, in stark contrast to the 21-to-1 ratio in 1965," the report says. "Over the last two decades, the ratio has been far higher than at any point from the 1960s to the early 1990s."
The report notes some limited progress. Last year's analysis—released amid the United Auto Workers strike at the "Big Three"—found that CEOs made 344 times as much as typical workers. There was a 19% decrease in CEOs' realized compensation from 2022 to 2023. The report also points out positive trends regarding how they are compensated.
"The composition of CEO compensation is shifting away from the use of stock options and toward stock awards—a promising move to align CEO pay to longer-term incentives," the report details. "In 2006, stock options accounted for just over 70% of stock-related pay in realized CEO compensation. But in 2023, stock options made up only 22%, with vested stock awards accounting for the rest. Stock-related pay (exercised stock options and vested stock awards) averaged $16.7 million in 2023 and accounted for 77.6% of average realized CEO compensation."
However, economic justice advocates argue that far more must be done to improve U.S. worker pay and job conditions.
The report highlights "how distorted CEO pay is, even compared with the most privileged workers in the U.S. economy."
EPI researchers found that "CEOs made over 9 times as much in salary as even the most privileged 0.1% of workers in the economy. This 9.4 ratio in 2022 was 6.8 points higher than the historical average of 2.6 over the 1965–1978 period."
"This is a large change, meaning that the relative pay of CEOs increased by an amount equal to the total annual wages of nearly seven of these very high-wage earners," the report states.
As EPI chief economist and report co-author Josh Bivens emphasized, "CEOs are paid so much more because of their extraordinary leverage over corporate boards, not because of an extraordinary skill or contribution they make to their firms."
"Exorbitant CEO pay has contributed to rising inequality in recent decades—concentrating earnings at the top and leaving fewer gains for ordinary workers," he said. "The silver lining in this otherwise unfortunate trend is that CEO pay can be curtailed without damaging economywide growth."
EPI's policy recommendations include implementing higher marginal income tax rates at the very top and hiking corporate tax rates for firms that have higher ratios of CEO-to-worker compensation.
Americans for Tax Fairness and the Institute for Policy Studies earlier this year identified 35 major U.S. corporations—including Ford, Netflix, and Tesla—that paid their top executives more than they paid in federal taxes between 2018 and 2022.
The new EPI report stresses that "ideally, tax reforms would be paired with changes in corporate governance."
EPI senior economist and report co-author Elise Gould said that "policies that limit CEOs' ability to collude with corporate boards to extract excessive compensation are needed to prevent the U.S. from becoming a winner-take-all society."
This post has been updated to note that annual compensation figures were adjusted for inflation.
Despite a decline in the total number of U.S. billionaires, the total wealth of the exclusive nine-figure-club grew by $500 billion over the last five months.
There are now 801 billionaires based in the United States with a combined wealth totaling $6.22 trillion, according to an Institute for Policy Studies analysis of the Forbes Real Time Billionaire List.
The total number of billionaires is down 11 people as of September 13, 2024 from April when Forbes published their 38th annual World’s Billionaire List. Despite that decline in the number of billionaires, the total wealth of the exclusive nine-figure-club grew by $500 billion over the last five months.
The top five billionaires and by individual wealth are:
There are now a total of 12 billionaires with more than $100 billion each. For context, the first person to cross the $100 billion personal wealth threshold—Jeff Bezos—only did so in 2018.
When Forbes started tracking wealth in 1982 there were only 13 billionaires on the Forbes 400 list and it took $75 million to join the list. Today, a person needs have a minimum of $3.2 billion to make the cut.
Among the wealthiest families on the Forbes list:
Many top billionaires have seen their wealth surge since the onset of the Covid-19 pandemic.
On March 18, 2020, Elon Musk had wealth valued just under $25 billion. By the start of the next year he became the richest person in the world with a net worth of $185 billion.
After a decline of his assets from the acquisition of Twitter (now X) and falling Tesla valuations, Musk’s wealth has almost reached its 2022 peak with $252 billion.
Jeff Bezos saw his wealth rise from $113 billion on March 18, 2020 to $204 billion in the September 13, 2024 survey.
Three Walton family members—Jim, Alice, and Rob—saw their combined assets increase from $161.1 billion on March 18, 2020 to $286 billion this September.