

SUBSCRIBE TO OUR FREE NEWSLETTER
Daily news & progressive opinion—funded by the people, not the corporations—delivered straight to your inbox.
5
#000000
#FFFFFF
To donate by check, phone, or other method, see our More Ways to Give page.

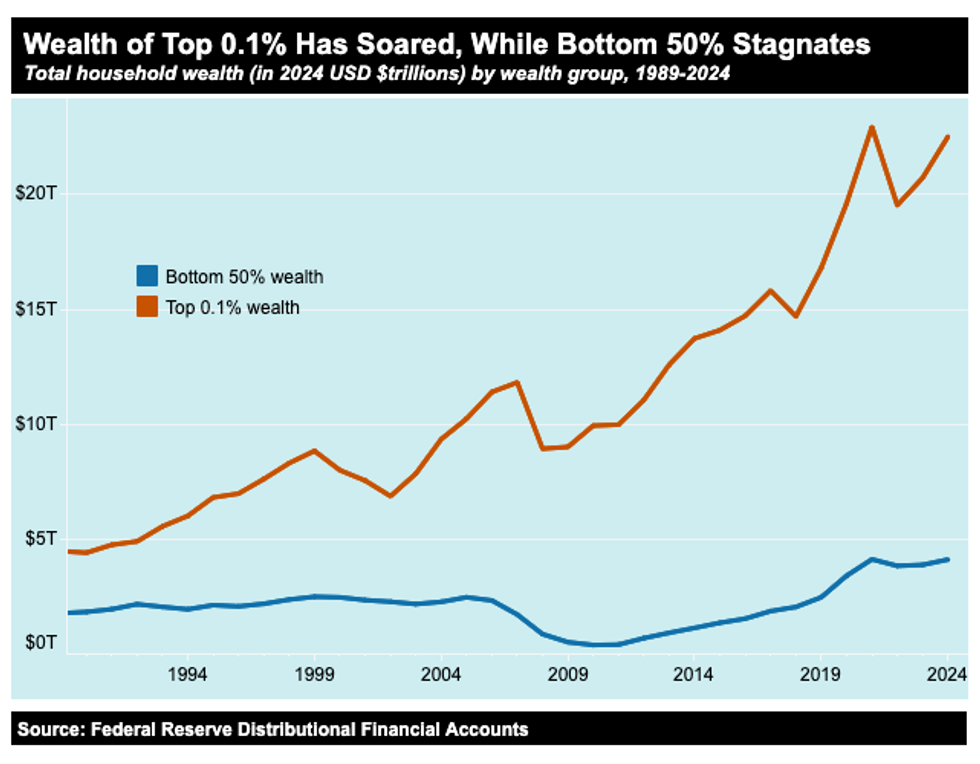
The share of the U.S. wealth pie owned by the top 0.1 percent grew 59.6 percent from 1989 to 2024, according to an Institute for Policy Studies analysis of Federal Reserve data, while the share of the U.S. wealth pie owned by the bottom 50 percent of households has declined 26.1 percent, adjusted for inflation.
This bottom half of households in America — 66 million of them — had $4.1 trillion all together at the end of 2024. The 905 billionaires in the United States hold a combined $7.8 trillion in wealth, according to Forbes data from September 29, 2025. This alarming narrowing of wealth has given those at the very top political influence and power that undermines our democracy.
IPS has long tracked wealth concentration; this piece in particular uses a combination of Federal Reserve estimates of wealth ownership on a quarterly basis at the Distribution of Financial Accounts (DFA) since 1989 and the Forbes Magazine’s Real Time Billionaires List. All figures in this analysis were converted to 2024 dollars, applying the Consumer Price Index Retroactive Series (R-CPI-U-RS).
Here’s how each subgroup of wealth holders have fared since 1989:
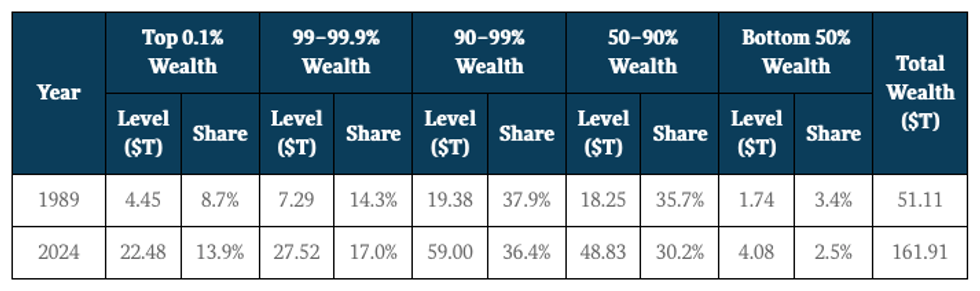
The Top 0.1 Percent. In 1989, the total wealth of the United States was $51.11 trillion. The richest 0.1 percent held $4.45 trillion or 8.7 percent of that total. By 2024, the total US wealth pie more than tripled to $161.91 trillion, with the richest 0.1 percent quintupling their wealth holdings up to $22.48 trillion. The top 0.1 percent’s share of the US wealth pie increased to 13.9 percent, a growth of 59.6 percent from 1989.
Top 1 Percent. Since 1989, the richest 1 percent have seen their household wealth more than quadruple from $11.74 trillion to $50 trillion at the end of 2024. Their share of the $162 trillion U.S. wealth pie increased from 23 percent in 1989 to 30.9 percent in 2024, a 34.4 percent increase.
Billionaires. In 1989, there were 66 US billionaires, according to Forbes Magazine, which started their Forbes 400 list in 1982. By September 29, 2025, there were 905 billionaires with a combined wealth of $7.8 trillion. The Fed data does not include a billionaire tier so it is difficult to get a full picture of their assets, but we can use Forbes’ Billionaire List as a proxy. One estimated comparison is that, in 2024, the wealthiest 1 percent held $50 trillion; the top 0.1 held $22.48 trillion, and 905 billionaires held $7.8 trillion.
Bottom 50 Percent. Meanwhile, the bottom 50 percent of households saw their share of the U.S. wealth pie shrink from 3.4 percent in 1989 to 2.5 percent in 2024, a decline of 26.1 percent.
Real estate ownership accounts for roughly half of all the assets owned by the bottom 50 percent of households. This group was hammered by the real estate meltdown that began in 2007 and helped trigger The Great Recession of 2008. In 2005, the bottom 50 percent had a net worth of $2.44 trillion. By 2010, this had declined to $360 billion. It took the bottom 50 percent 9 years to recover its wealth to the level it achieved in 2005 at $2.44 trillion.
The share of the U.S. wealth pie owned by the top 0.1 percent grew 59.6 percent from 1989 to 2024, according to an Institute for Policy Studies analysis of Federal Reserve data, while the share of the U.S. wealth pie owned by the bottom 50 percent of households has declined 26.1 percent, adjusted for inflation.
This bottom half of households in America — 66 million of them — had $4.1 trillion all together at the end of 2024. The 905 billionaires in the United States hold a combined $7.8 trillion in wealth, according to Forbes data from September 29, 2025. This alarming narrowing of wealth has given those at the very top political influence and power that undermines our democracy.
IPS has long tracked wealth concentration; this piece in particular uses a combination of Federal Reserve estimates of wealth ownership on a quarterly basis at the Distribution of Financial Accounts (DFA) since 1989 and the Forbes Magazine’s Real Time Billionaires List. All figures in this analysis were converted to 2024 dollars, applying the Consumer Price Index Retroactive Series (R-CPI-U-RS).
Here’s how each subgroup of wealth holders have fared since 1989:
The Top 0.1 Percent. In 1989, the total wealth of the United States was $51.11 trillion. The richest 0.1 percent held $4.45 trillion or 8.7 percent of that total. By 2024, the total US wealth pie more than tripled to $161.91 trillion, with the richest 0.1 percent quintupling their wealth holdings up to $22.48 trillion. The top 0.1 percent’s share of the US wealth pie increased to 13.9 percent, a growth of 59.6 percent from 1989.
Top 1 Percent. Since 1989, the richest 1 percent have seen their household wealth more than quadruple from $11.74 trillion to $50 trillion at the end of 2024. Their share of the $162 trillion U.S. wealth pie increased from 23 percent in 1989 to 30.9 percent in 2024, a 34.4 percent increase.
Billionaires. In 1989, there were 66 US billionaires, according to Forbes Magazine, which started their Forbes 400 list in 1982. By September 29, 2025, there were 905 billionaires with a combined wealth of $7.8 trillion. The Fed data does not include a billionaire tier so it is difficult to get a full picture of their assets, but we can use Forbes’ Billionaire List as a proxy. One estimated comparison is that, in 2024, the wealthiest 1 percent held $50 trillion; the top 0.1 held $22.48 trillion, and 905 billionaires held $7.8 trillion.
Bottom 50 Percent. Meanwhile, the bottom 50 percent of households saw their share of the U.S. wealth pie shrink from 3.4 percent in 1989 to 2.5 percent in 2024, a decline of 26.1 percent.
Real estate ownership accounts for roughly half of all the assets owned by the bottom 50 percent of households. This group was hammered by the real estate meltdown that began in 2007 and helped trigger The Great Recession of 2008. In 2005, the bottom 50 percent had a net worth of $2.44 trillion. By 2010, this had declined to $360 billion. It took the bottom 50 percent 9 years to recover its wealth to the level it achieved in 2005 at $2.44 trillion.