

SUBSCRIBE TO OUR FREE NEWSLETTER
Daily news & progressive opinion—funded by the people, not the corporations—delivered straight to your inbox.
5
#000000
#FFFFFF
To donate by check, phone, or other method, see our More Ways to Give page.
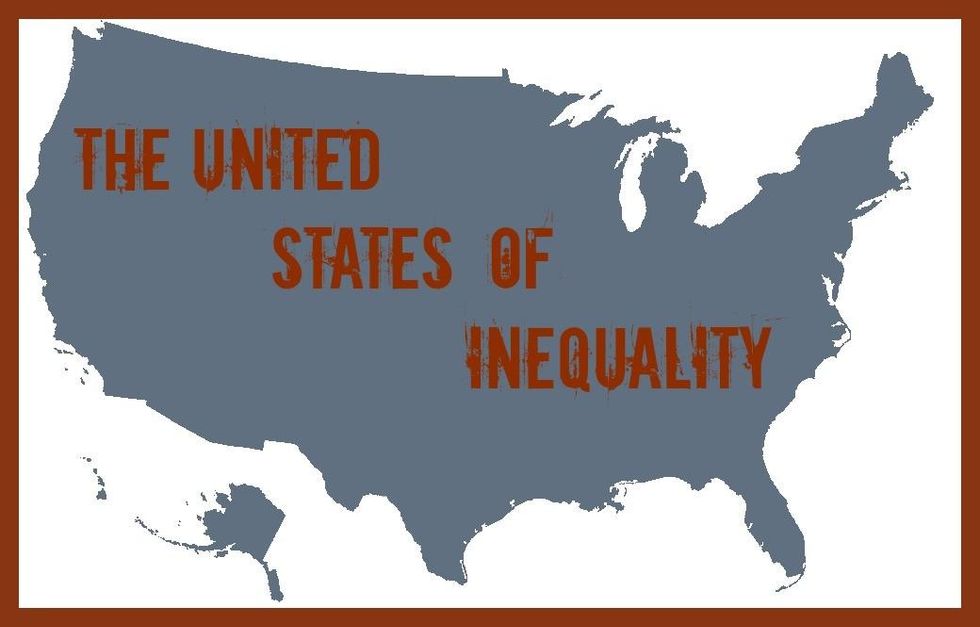
This is all based on a new state-level study, The Increasingly Unequal States of America: Income Inequality by State, which looks at how inequality has seized hold of the national economy both in the generation leading up to the great recession of 2008 and in the several years following where a so-called "recovery" was experienced by the financial elite while the majority of U.S. population continues to claw its way back.
"The levels of inequality we are seeing across the country provide more proof that the economy is not working for the vast majority of Americans and has not for decades," said Mark Price, an economist at the Keystone Research Center, who co-authored the report on behalf of the Economic Analysis and Research Network (EARN). "It is unconscionable that most of America's families have shared in so little of the country's prosperity over the last several decades."
Check out the interactive state-by-state map on inequality generated by the study's authors.
Numerous studies in recent years have exposed the persistent pattern of income and wealth inequality in the United States, but as Price's co-author Estelle Sommeiller explains, "our study shows that this one percent economy is not just a national story but is evident in every state, and every region."
Though some states show higher levels of inequality, the pattern nationally is firm. What is also made clear by the study is the degree to which specific policies--including the writing of tax law, the climate set for labor conditions, and the setting of wages--have all contributed directly to this pattern where those at the very top benefit from a growing economy and those at the bottom receive increasingly less reward for their hard work.
"It's clear that policies were set to favor the one percent and those policies can, and should, be changed," Doug Hall, director of the EARN program said. "In order to have widespread income growth, bold policies need to be enacted to increase the minimum wage, create low levels of unemployment, and strengthen the rights of workers to organize."
Among the report's key findings:
___________________________________